


Egypt's Tech Scene 2022 (Part 1 - Salaries)
An overview of Egypt's 2022 Tech Market Salaries


Introduction
Few weeks ago we started a new initiative to clear the ambiguity around Egypt's Tech Market. This year we are trying to answer some questions for the community such as:
- Do Computer-related graduates earn more than non-CS graduates?
- Do I really need a Computer-related degree to work in Tech?
- Is there a gender pay gap within the Tech Market? And how wide is it?
- What are the most loved technologies and tools within Egypt's Tech Market?
We are trying to answer some questions for the individuals such as:
- Am I being fairly compensated?
- Which companies are paying above the market average?
- How much should my expected salary for the next role be?
- Which technology should I learn to increase my chances to land a better job in the market?
And we are trying to answer some questions for the companies such as:
- How to make sure my company is still competitive in this market?
- How to retain my talents?
- How the Leveling System actually work within Egypt's Tech Market? How to map years of experience to levels?
- I'm building a new product, which technologies should I use that matches my use-case and at the same time won't give me hard time to find talents who actually use it?
We originally planned to publish the full report by the end of November, but since Egypt's currency was floated (again!), it didn't make sense to wait until then. As a result we are publishing part of the full report, especially the part that focuses on salaries.
Therefore I would like to apologise for any mistakes upfront. I know the quality of this post isn't going to be the best as I needed to get the numbers out as soon as possible, but your feedback will be appreciated to make it better. I will also do my best to translate it to Arabic in the next few days.
Since we collected the currencies in which the salaries are being paid by in the survey, we have adjusted all the numbers to USD = 23.2 EGP. We also need to point out that we have collected all the data between August and October. Therefore we treated the USD = 19.5 EGP as a pre-inflation rate to correct the numbers.
And most important, all the salaries are going to be the Total NET Compensation (Base + Bonus) in EGP.
Disclaimer: This by no means is a comprehensive overview of the market, it's biased toward my network and the companies I'm interested in. Having said that, I assure you that I made an effort trying to clean the data and make it fair. I didn't include anyone working for a remote company, all the data that we analyse here are shared by Software Engineers working in companies operating in Egypt.
Data Analysis
We have received around ~1300 responses to the survey, around 800+ were verified (By profile, email or company). So I believe there's high confidence in this sample to actually represents the population.
Fields
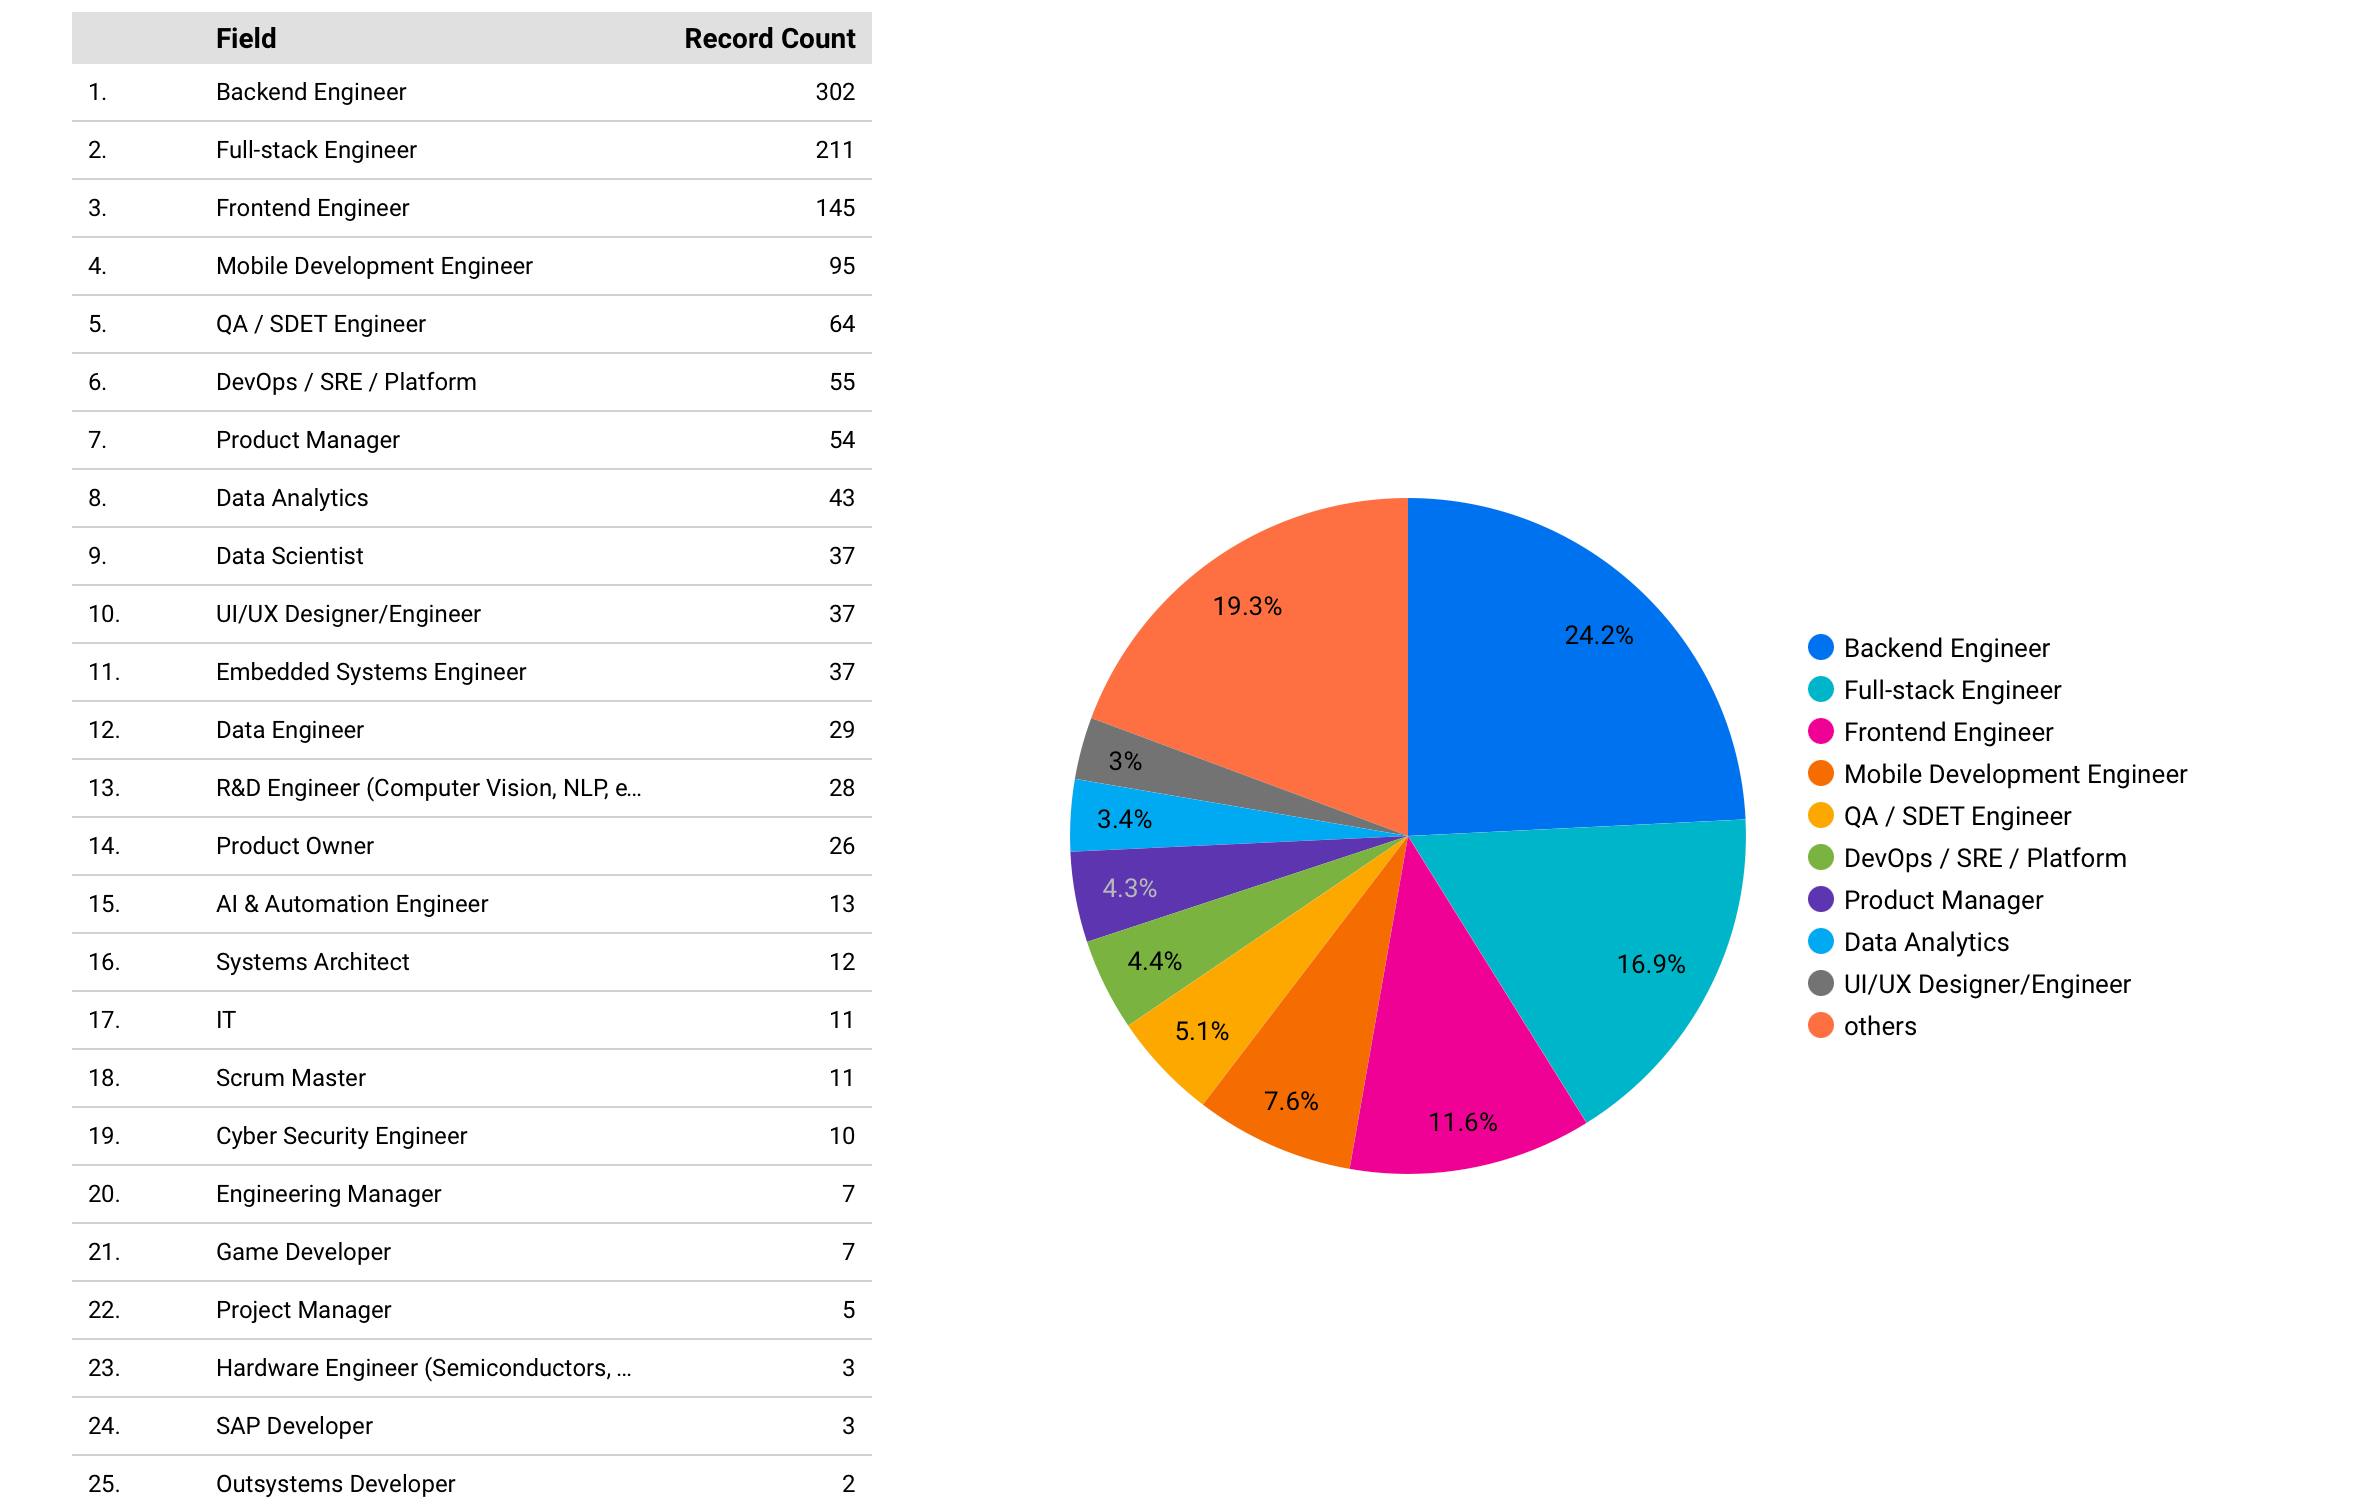
It wasn't much of a surprise that the majority of respondents were from the Engineering side. But I'm glad we received lots of responses from Data and Product respondents as well.
And therefore the fields we are going to focus on in this Post in Engineering are:
- Backend
- Fullstack
- Frontend
- Mobile
- QA
- DevOps
- Embedded
And in Product:
- Product Managers
- Product Owners
- UI/UX Designers
And in Data:
- Data Analytics
- Data Scientists
- Data Engineers
Levels
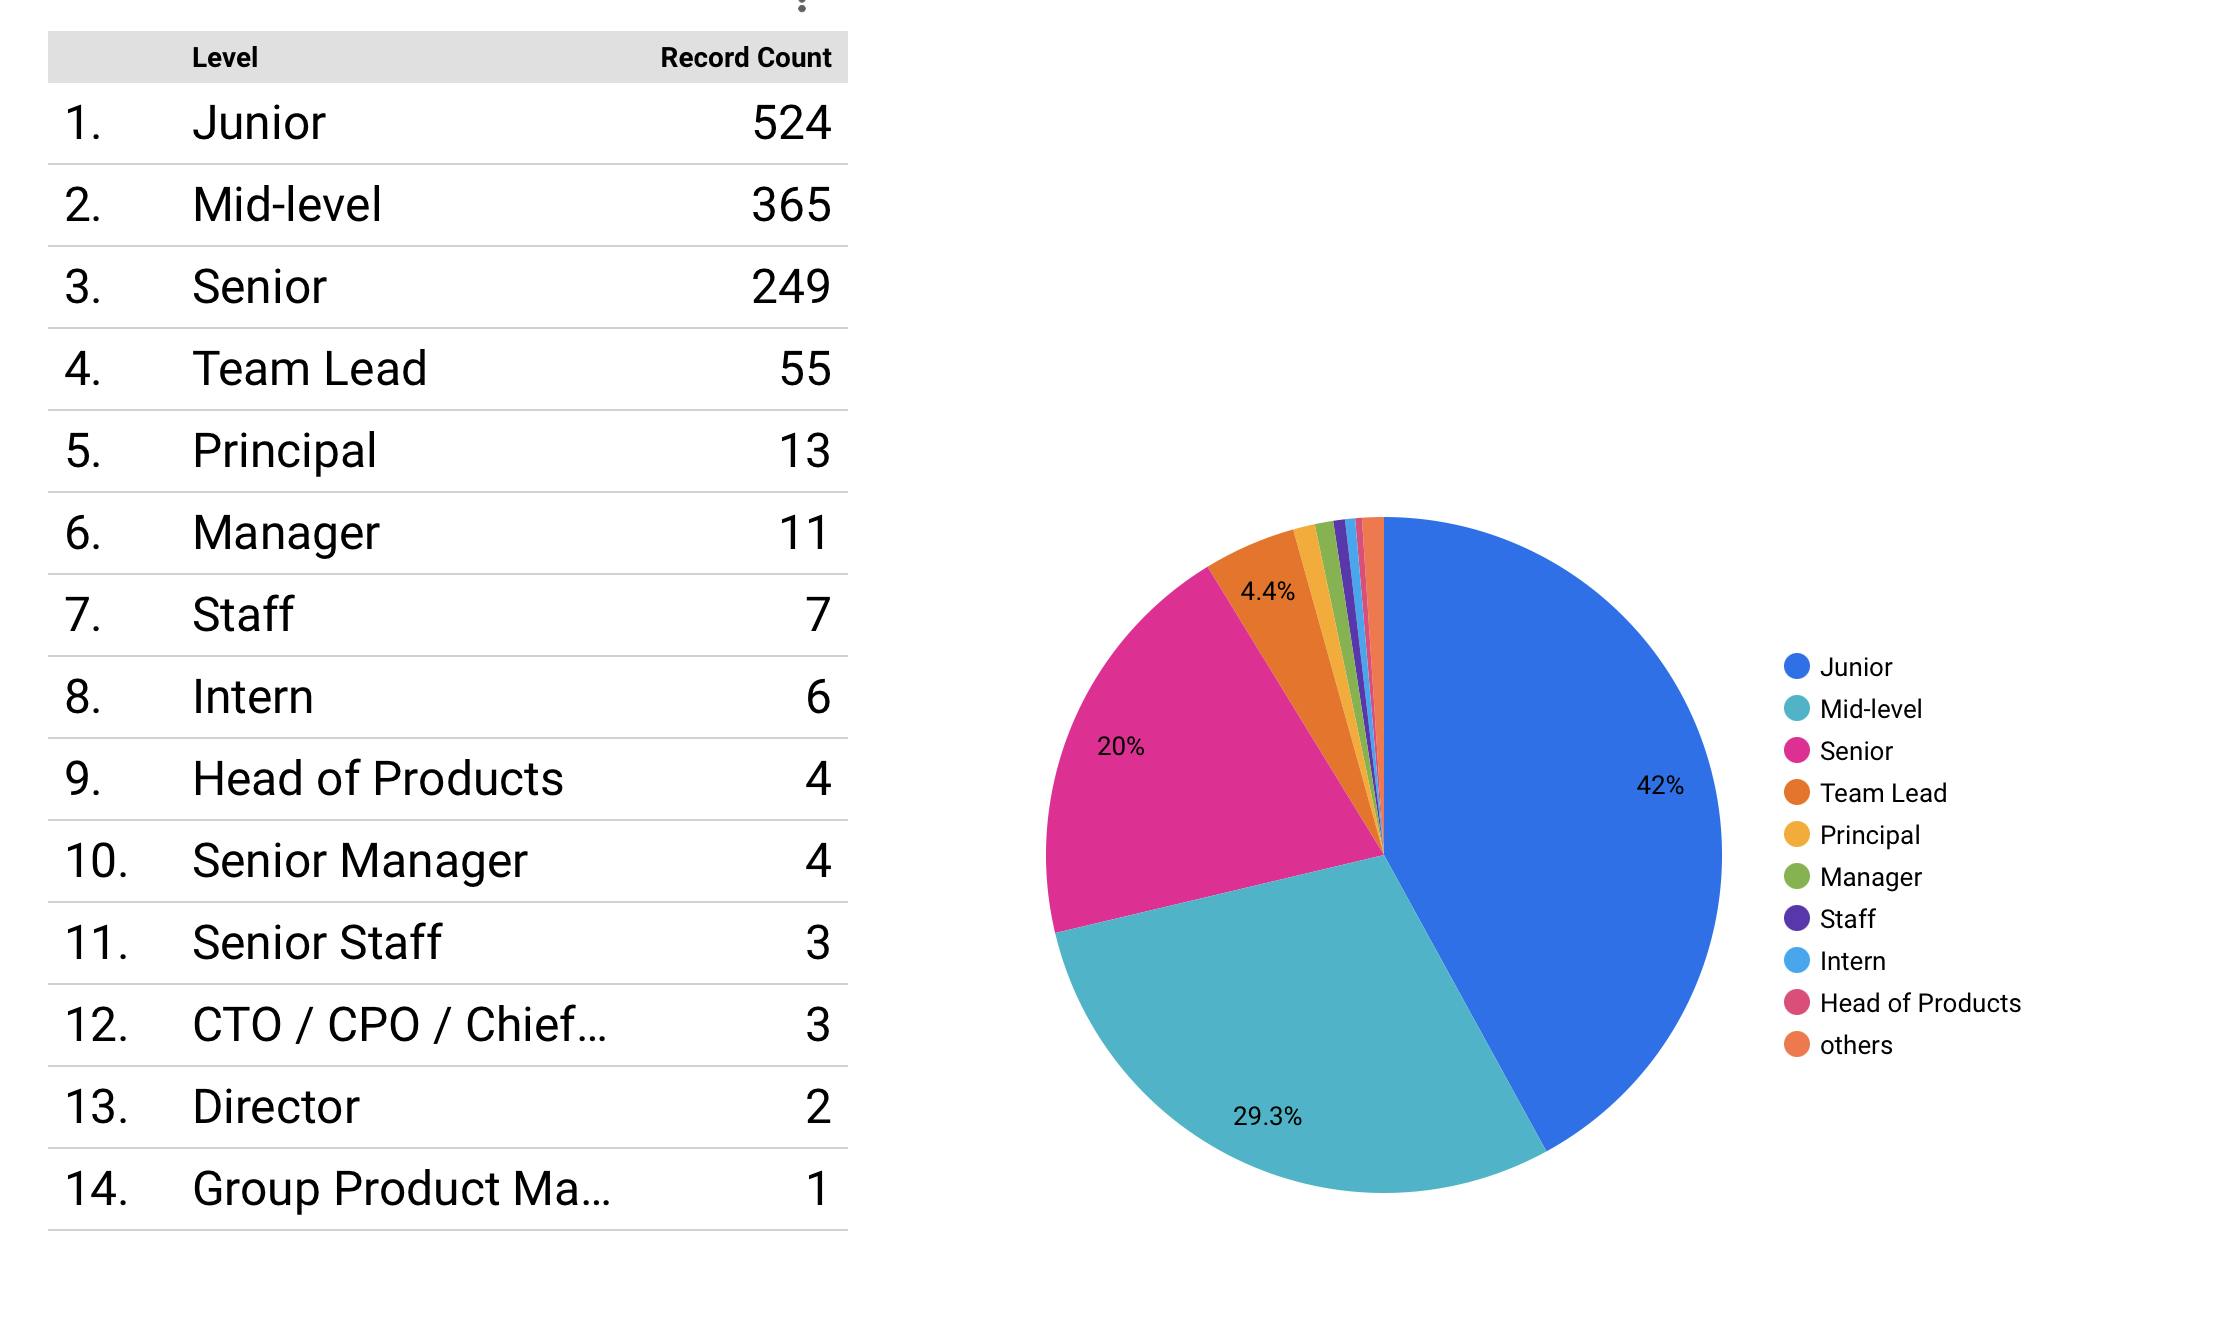
The majority of respondents are juniors, mid-levels and seniors. The higher up you move in the career ladder, the less likely you will interact with these surveys.
And therefore the Levels we are going to focus on in this post will be:
- Junior
- Mid-level
- Senior
Years of Experience
The second number is always going to be exclusive in these ranges. So when you read "[1-3[" or 1-3 This means these are the respondents who has 1 or more years of experience but less than 3 years of experience.
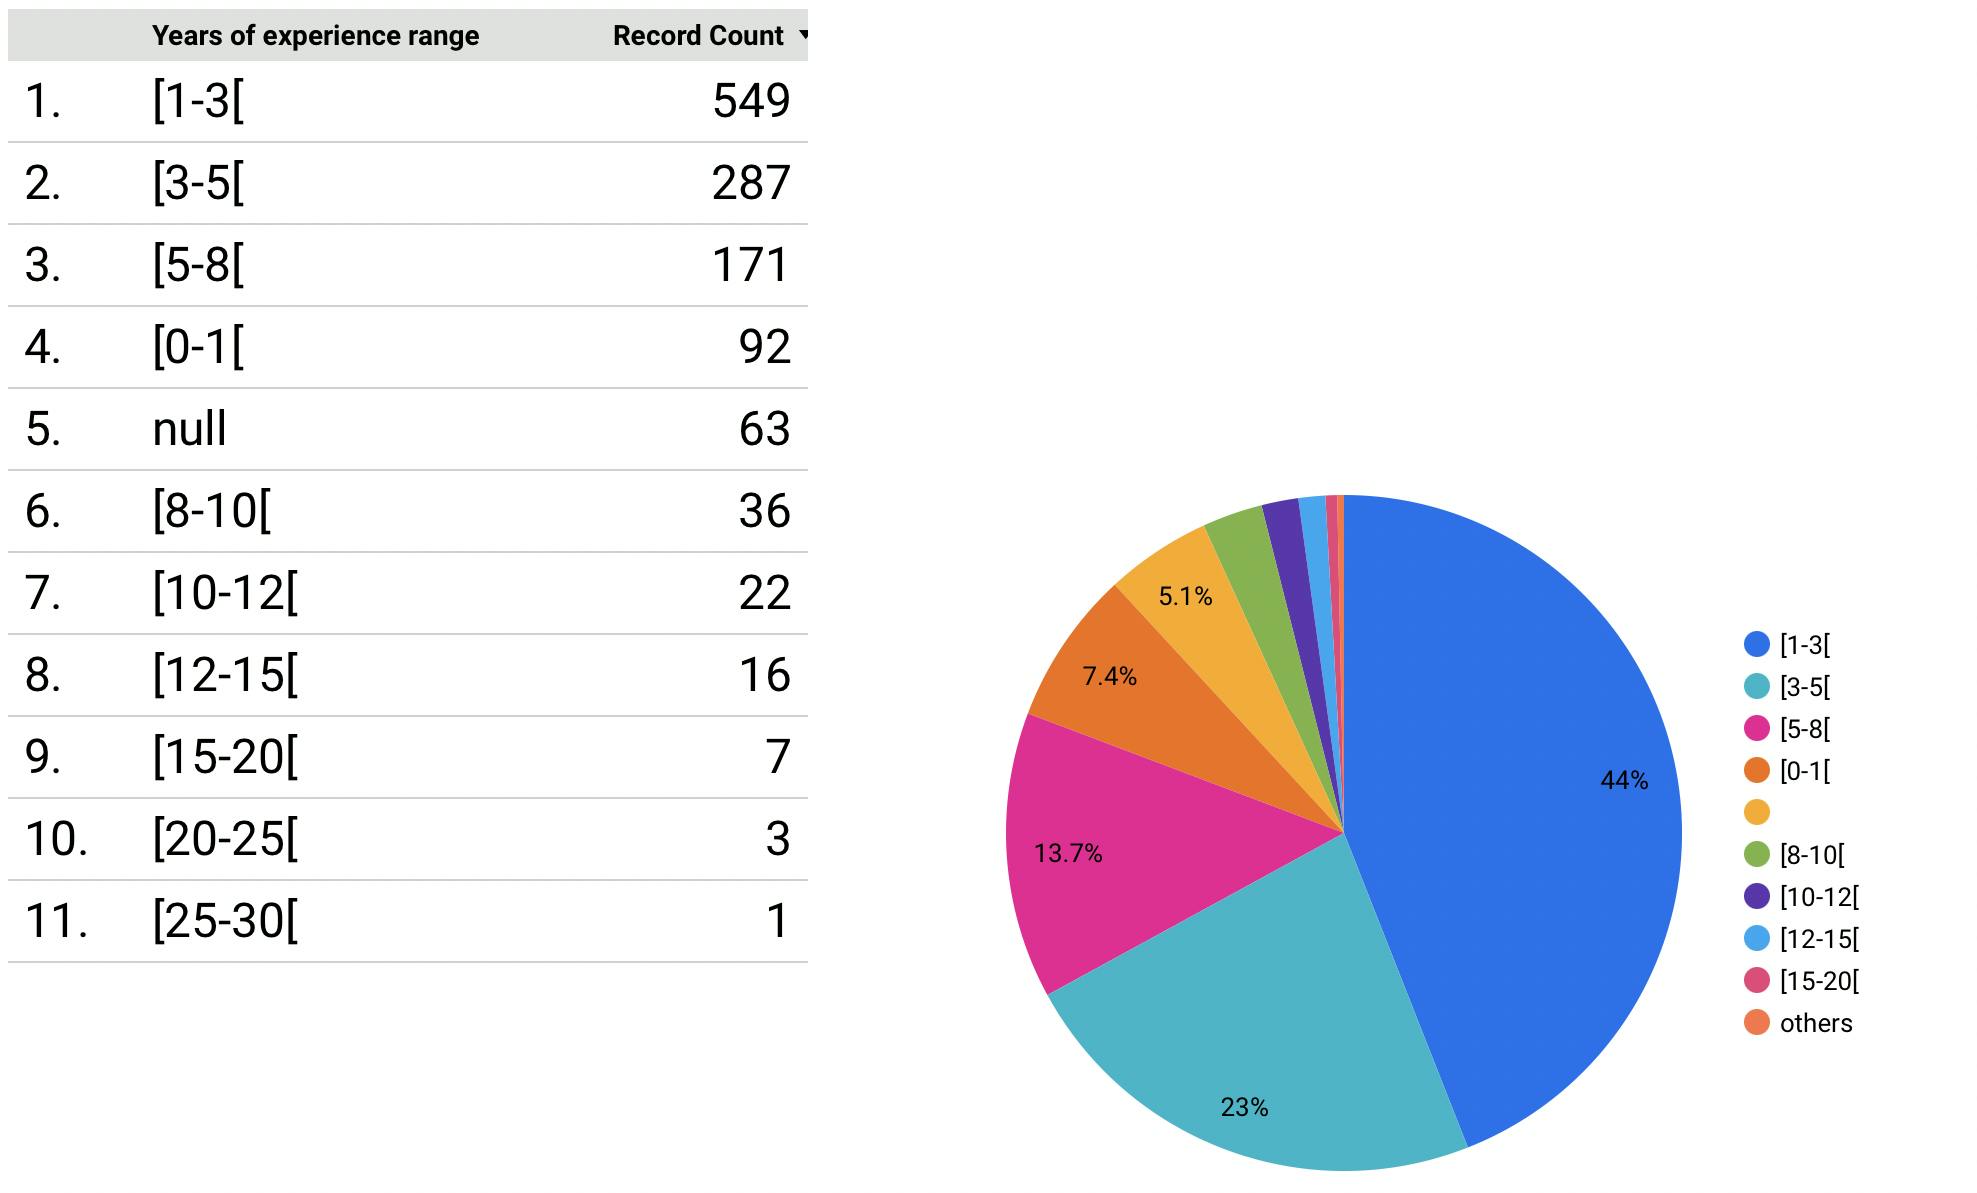
As a result, we will only focus on those with 0-8 years of experience.
Company Size
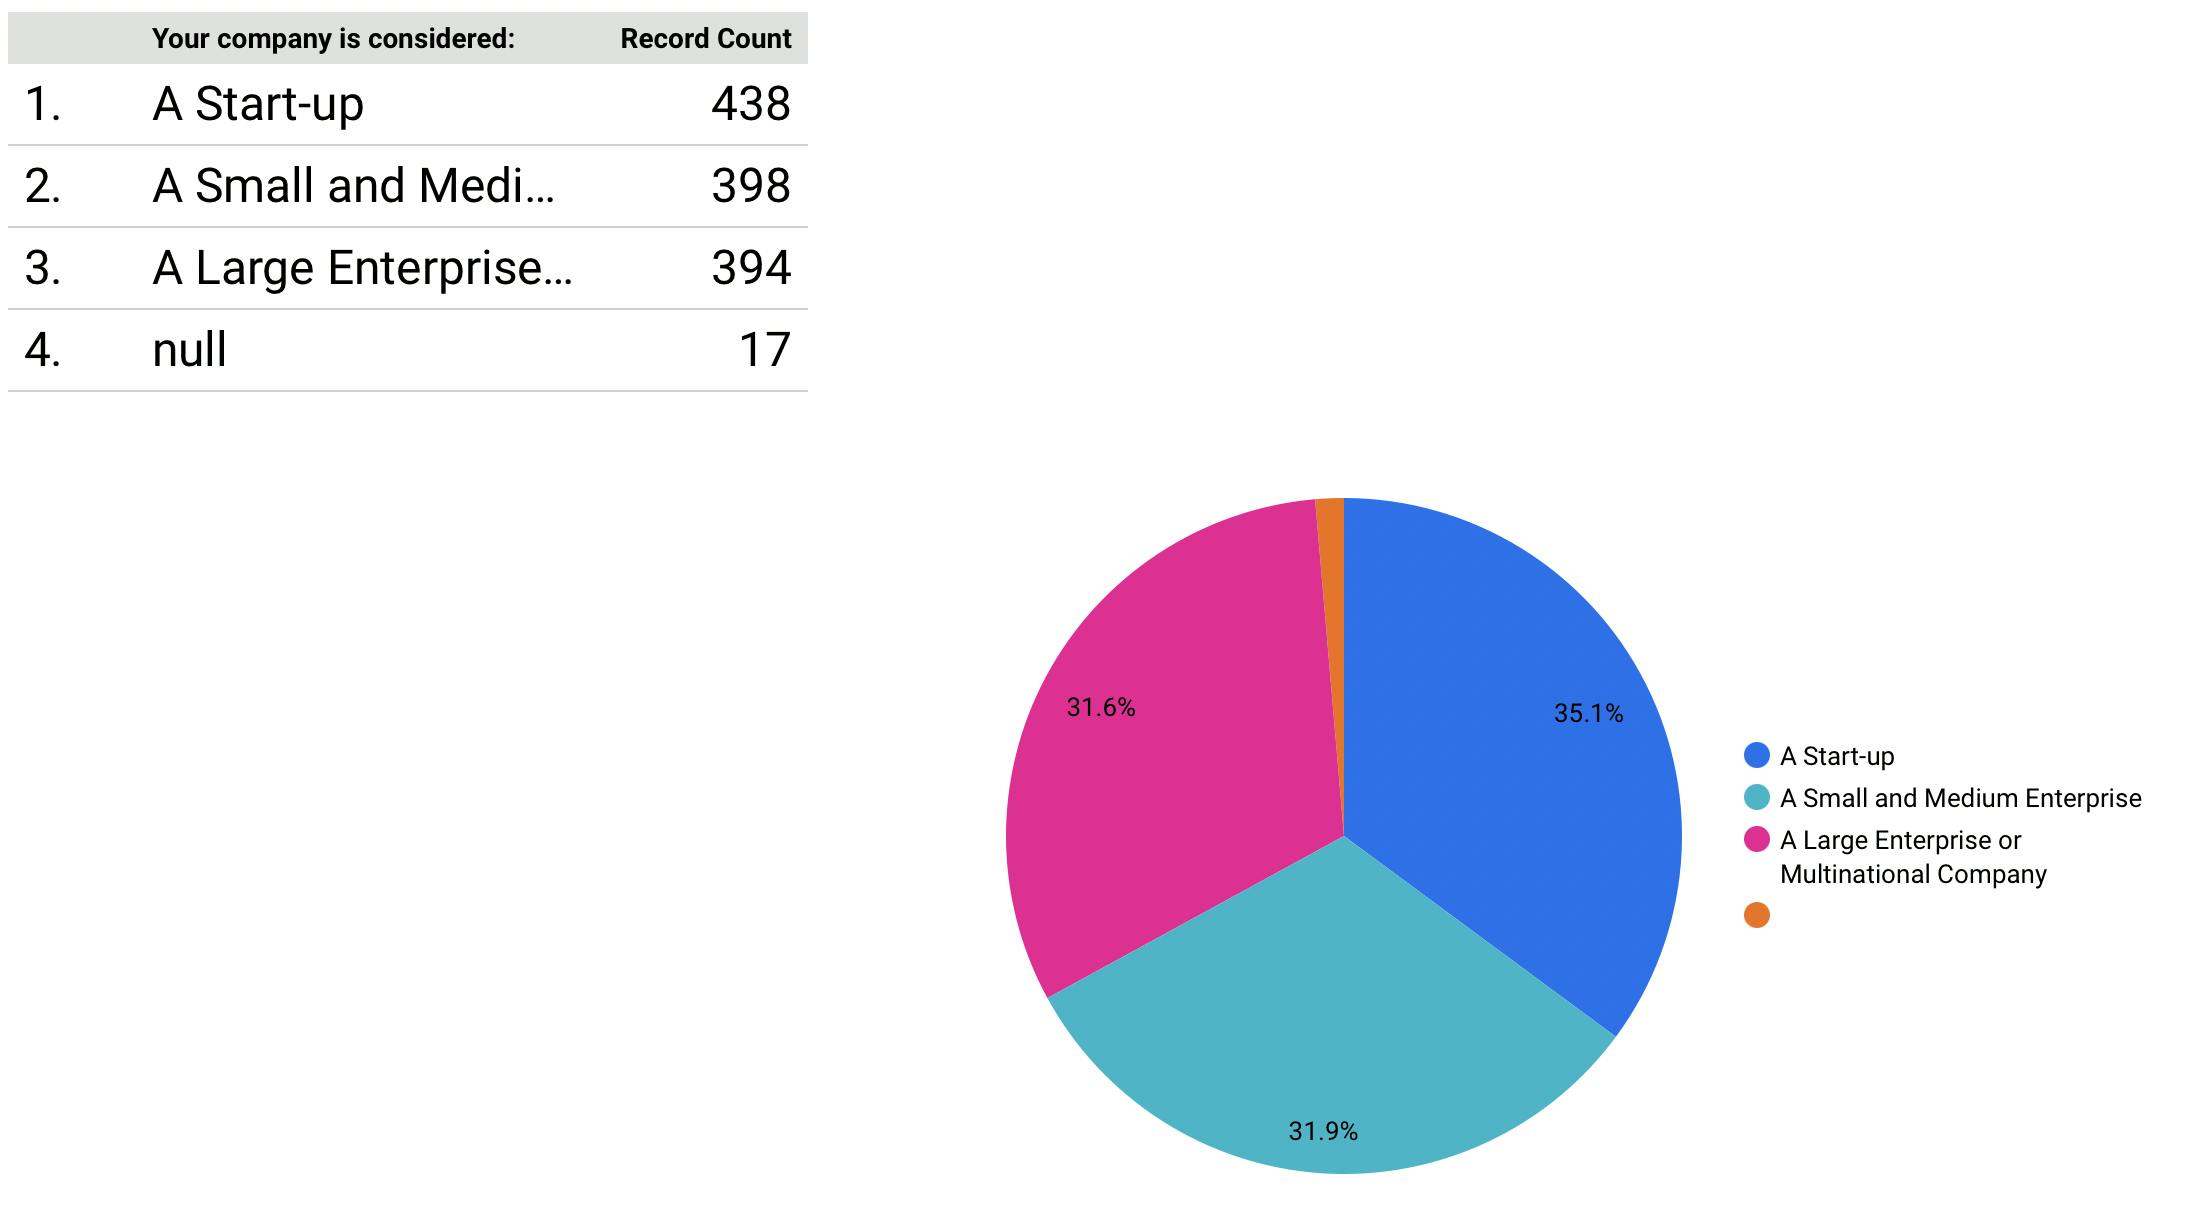
The respondents were from all company sizes. We received responses from employees in almost every tech company in Egypt. In some large companies we even received 40+ responses!
Work from
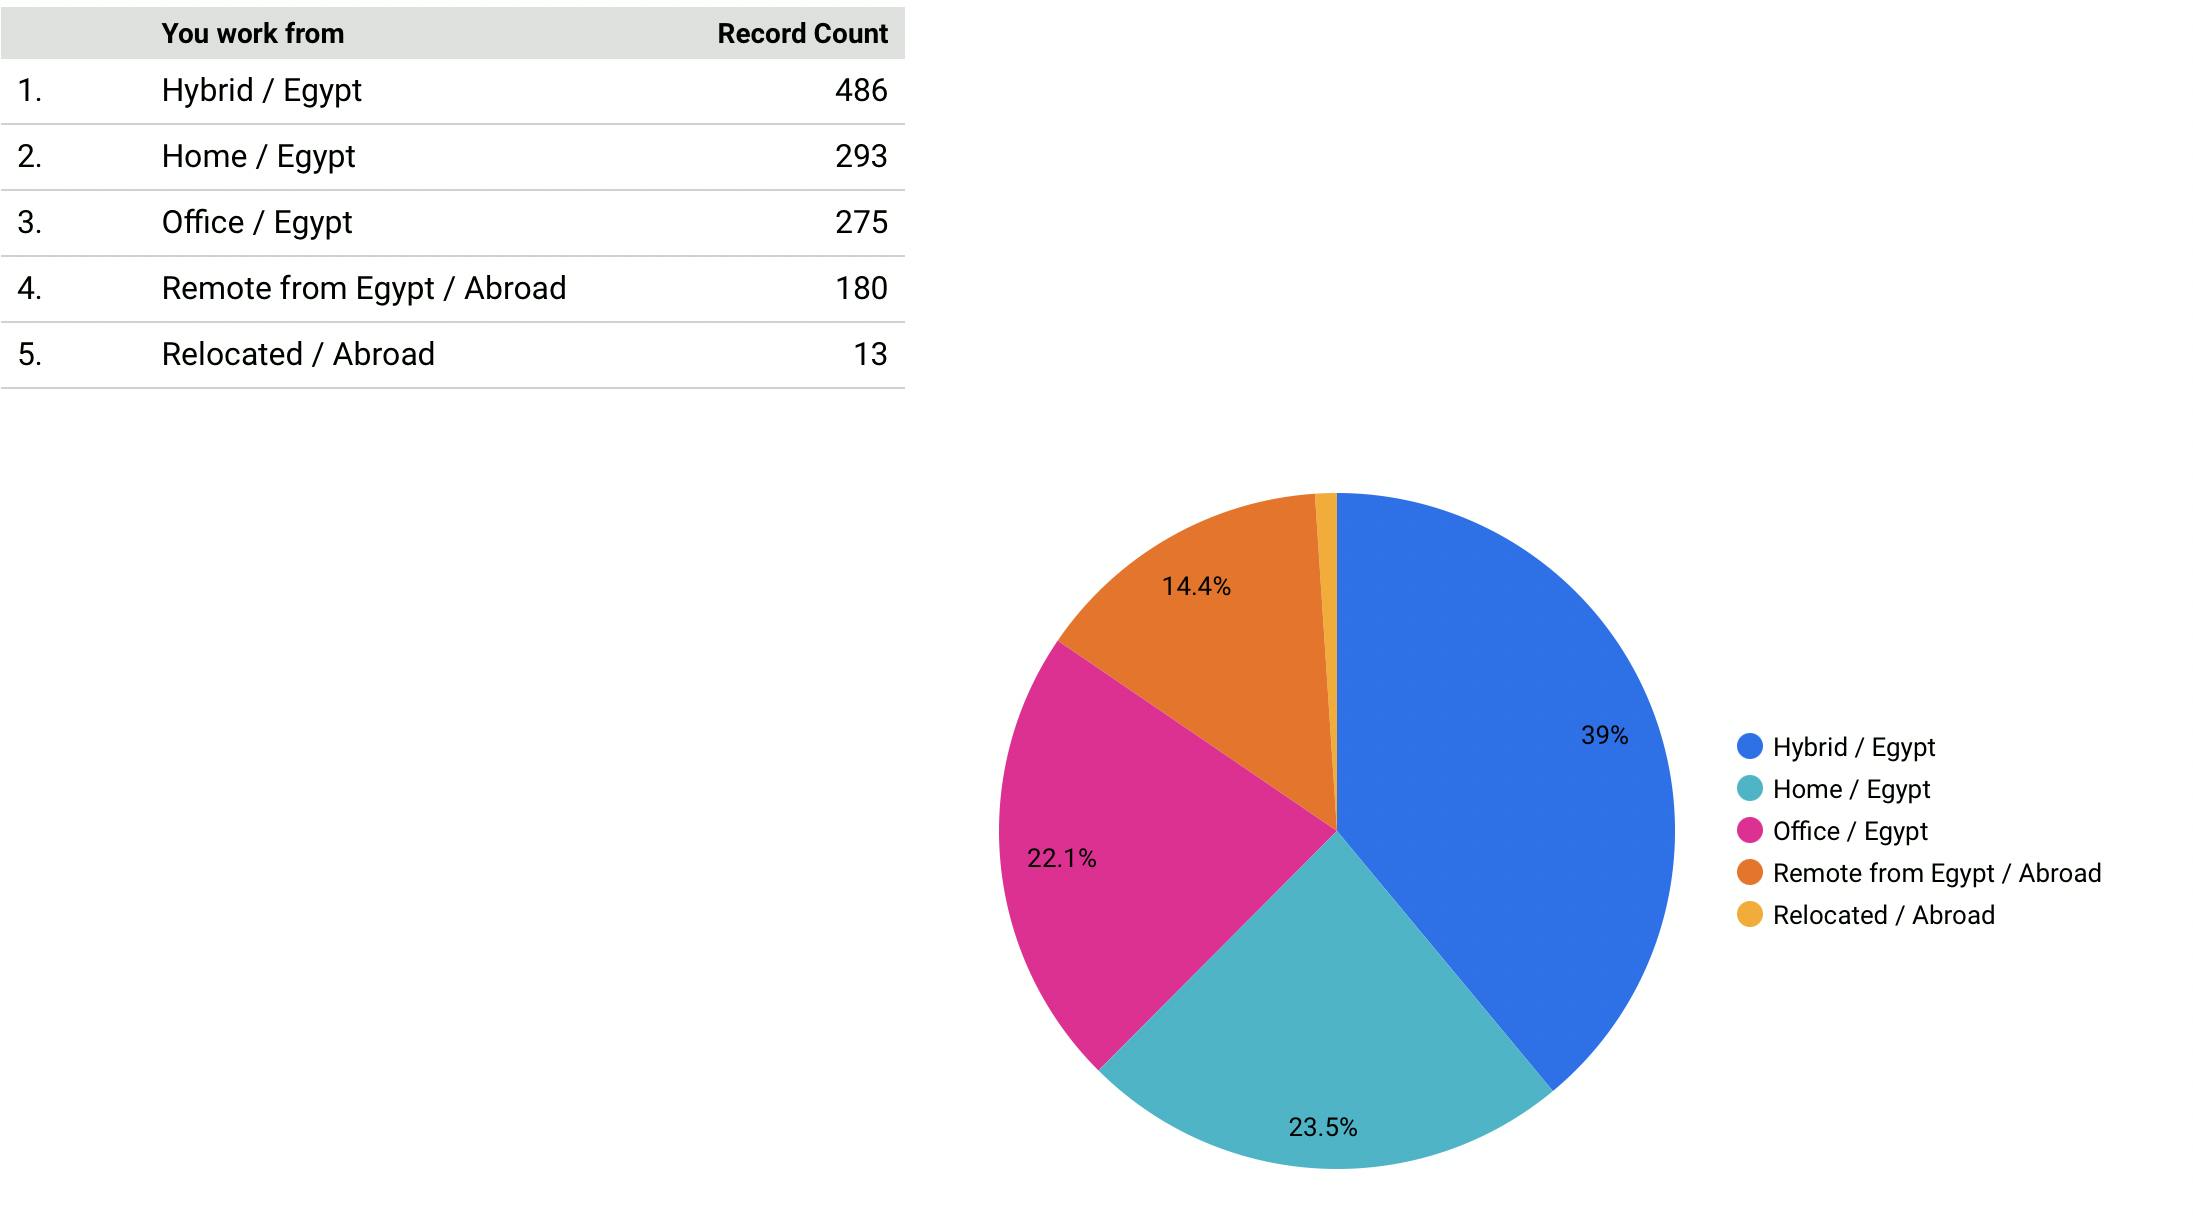
Around 39% of the Egypt's tech market are working from home and office in a hybrid settings, while 23.5% are solely working from home. Only 22.1% are working full time from office. This can be bad news for the companies forcing full office settings, because when we asked what's the employees preferred settings their responses were:
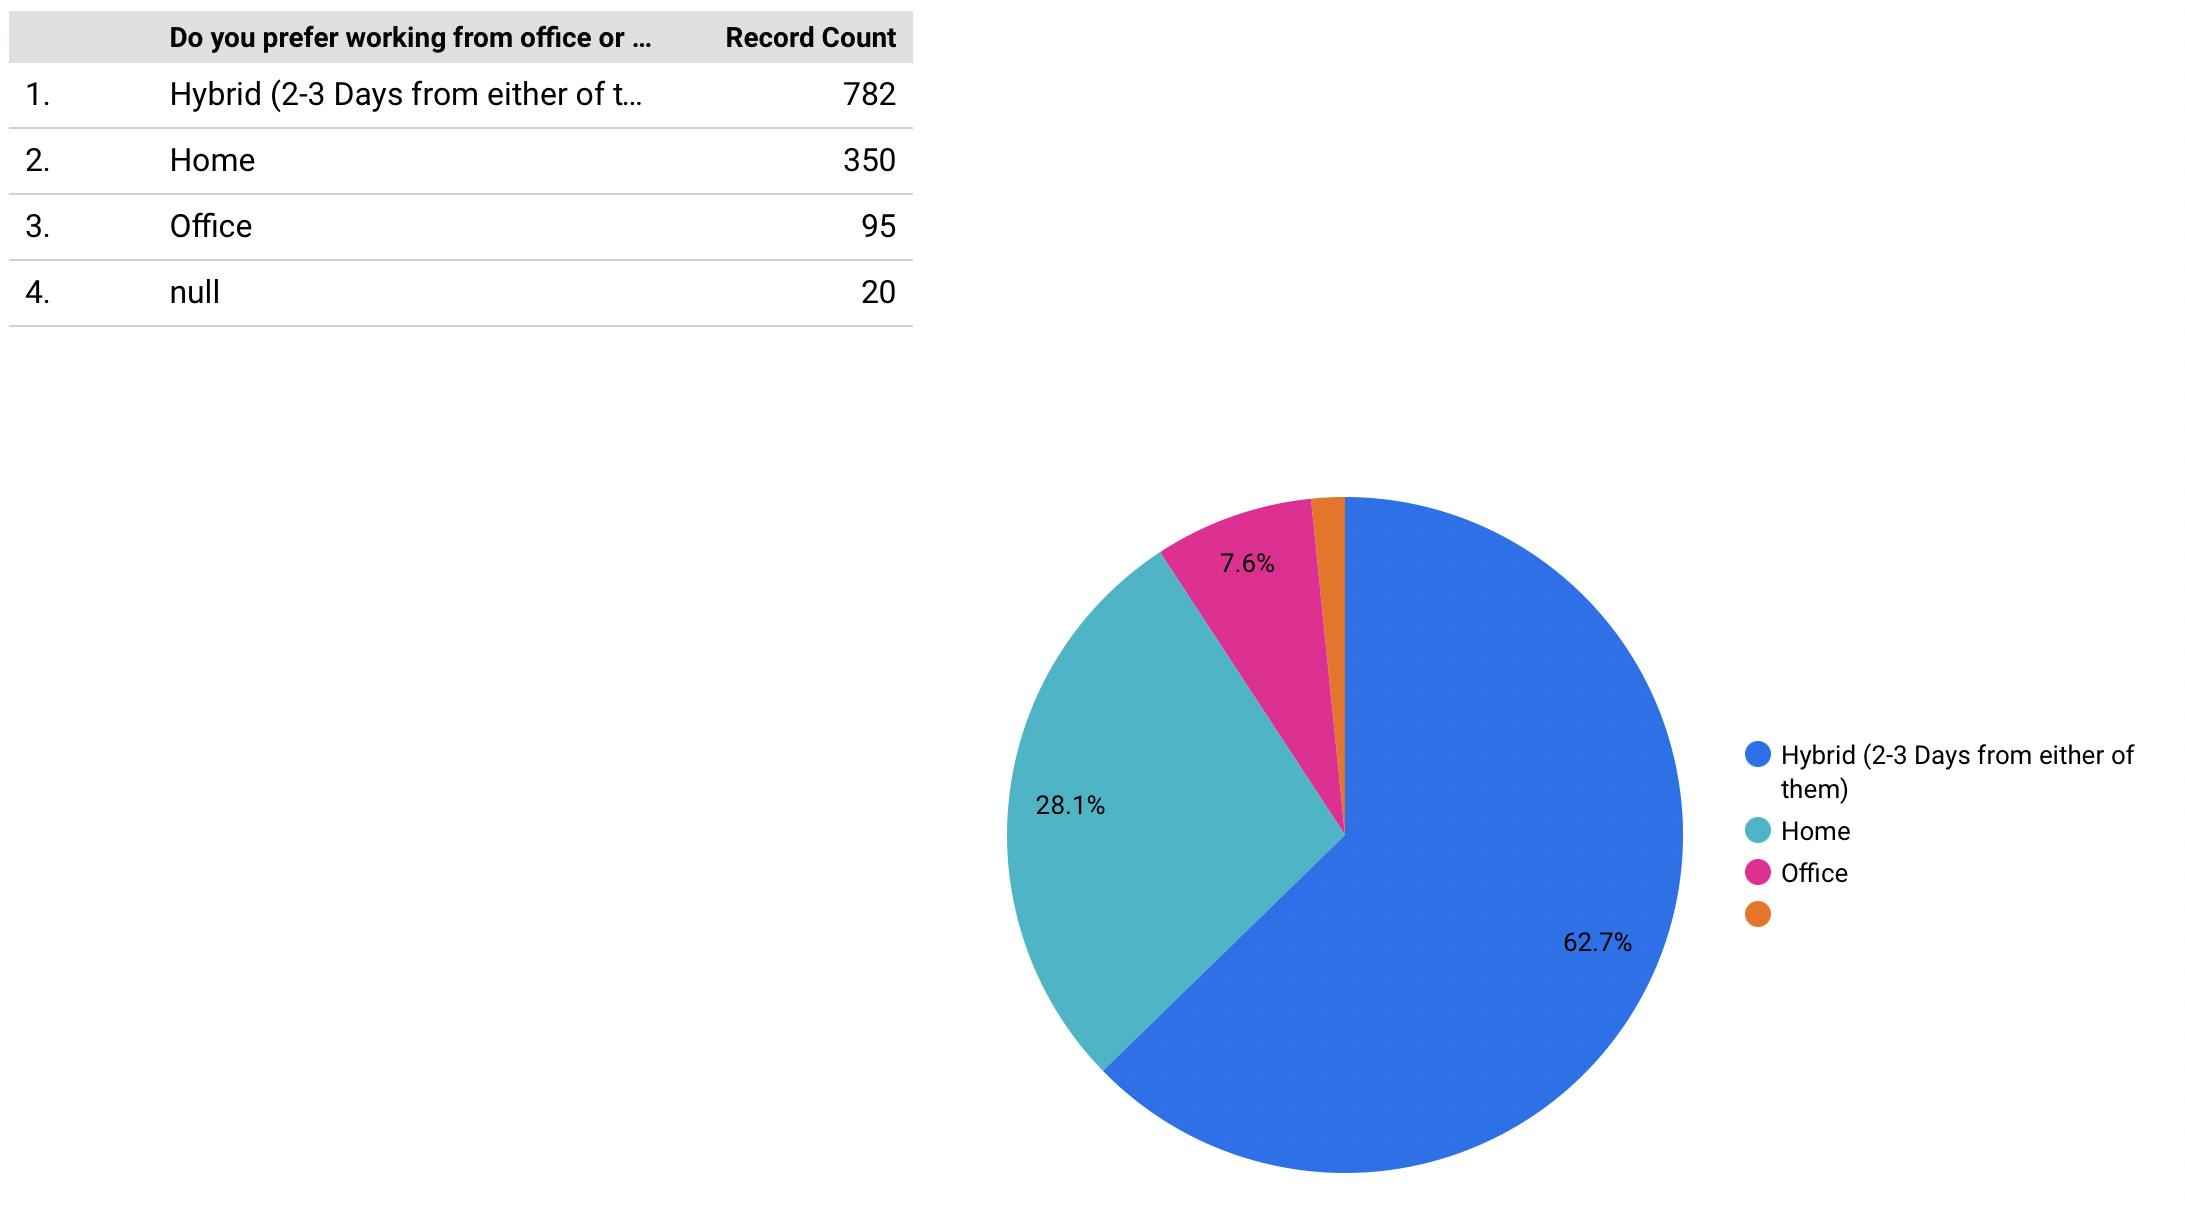
More than 60% actually preferred hybrid setting, but only 7.5% thought that they prefer to work full time from office.
Gender
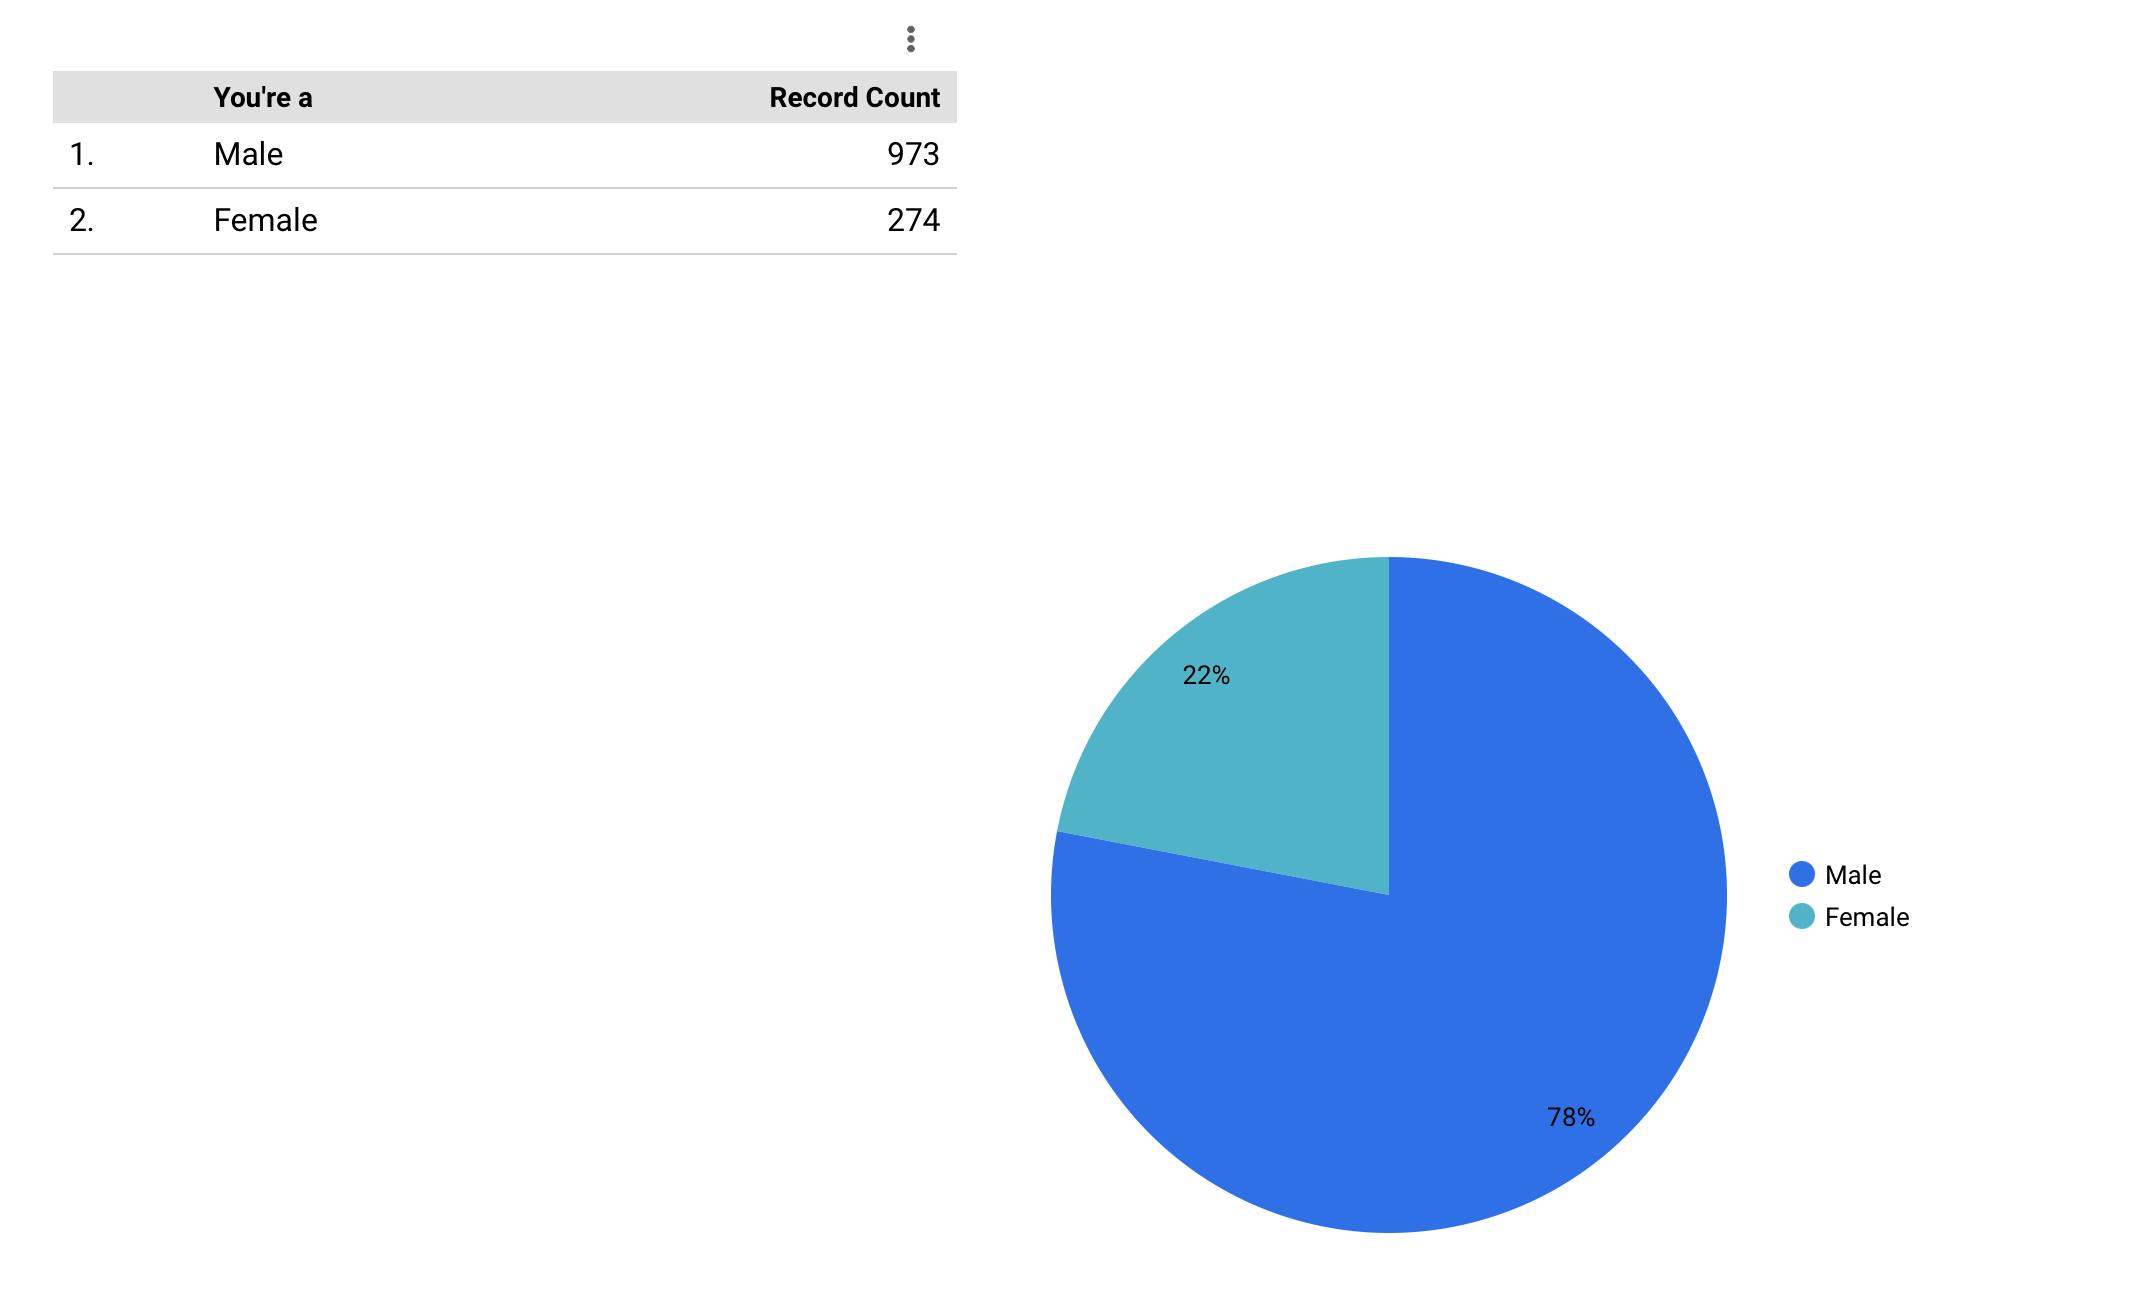
It will come to no surprise that Egypt's Tech Market is male dominant. Only 22% of the respondents were females. When we publish the full report we will dive in details in this part, we will look at which tech areas do women choose, how their salaries differ than men in each level and field.
Education
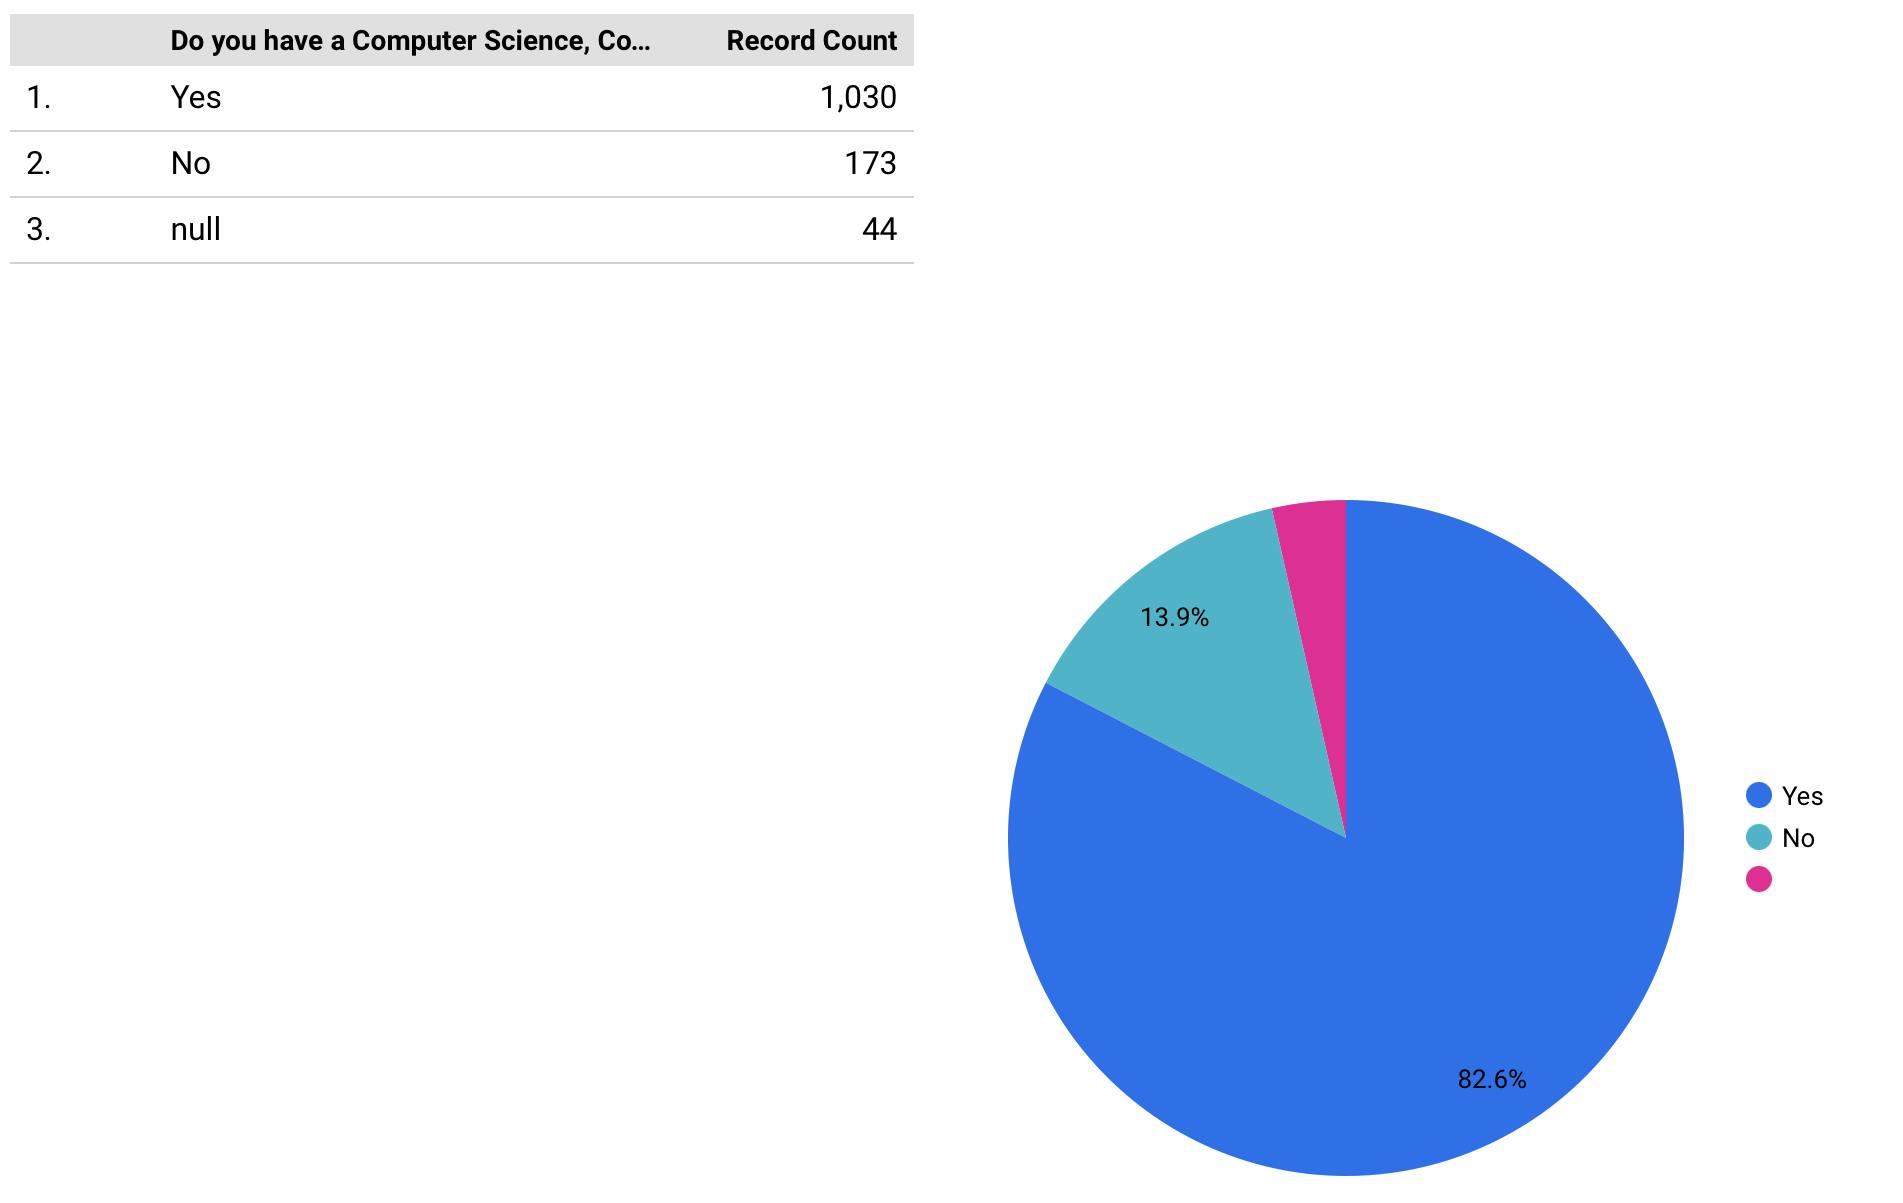
Only 14% are shifting from a non-Computer major. Actually more than 80% have Computer-related degree.
Salary Satisfaction
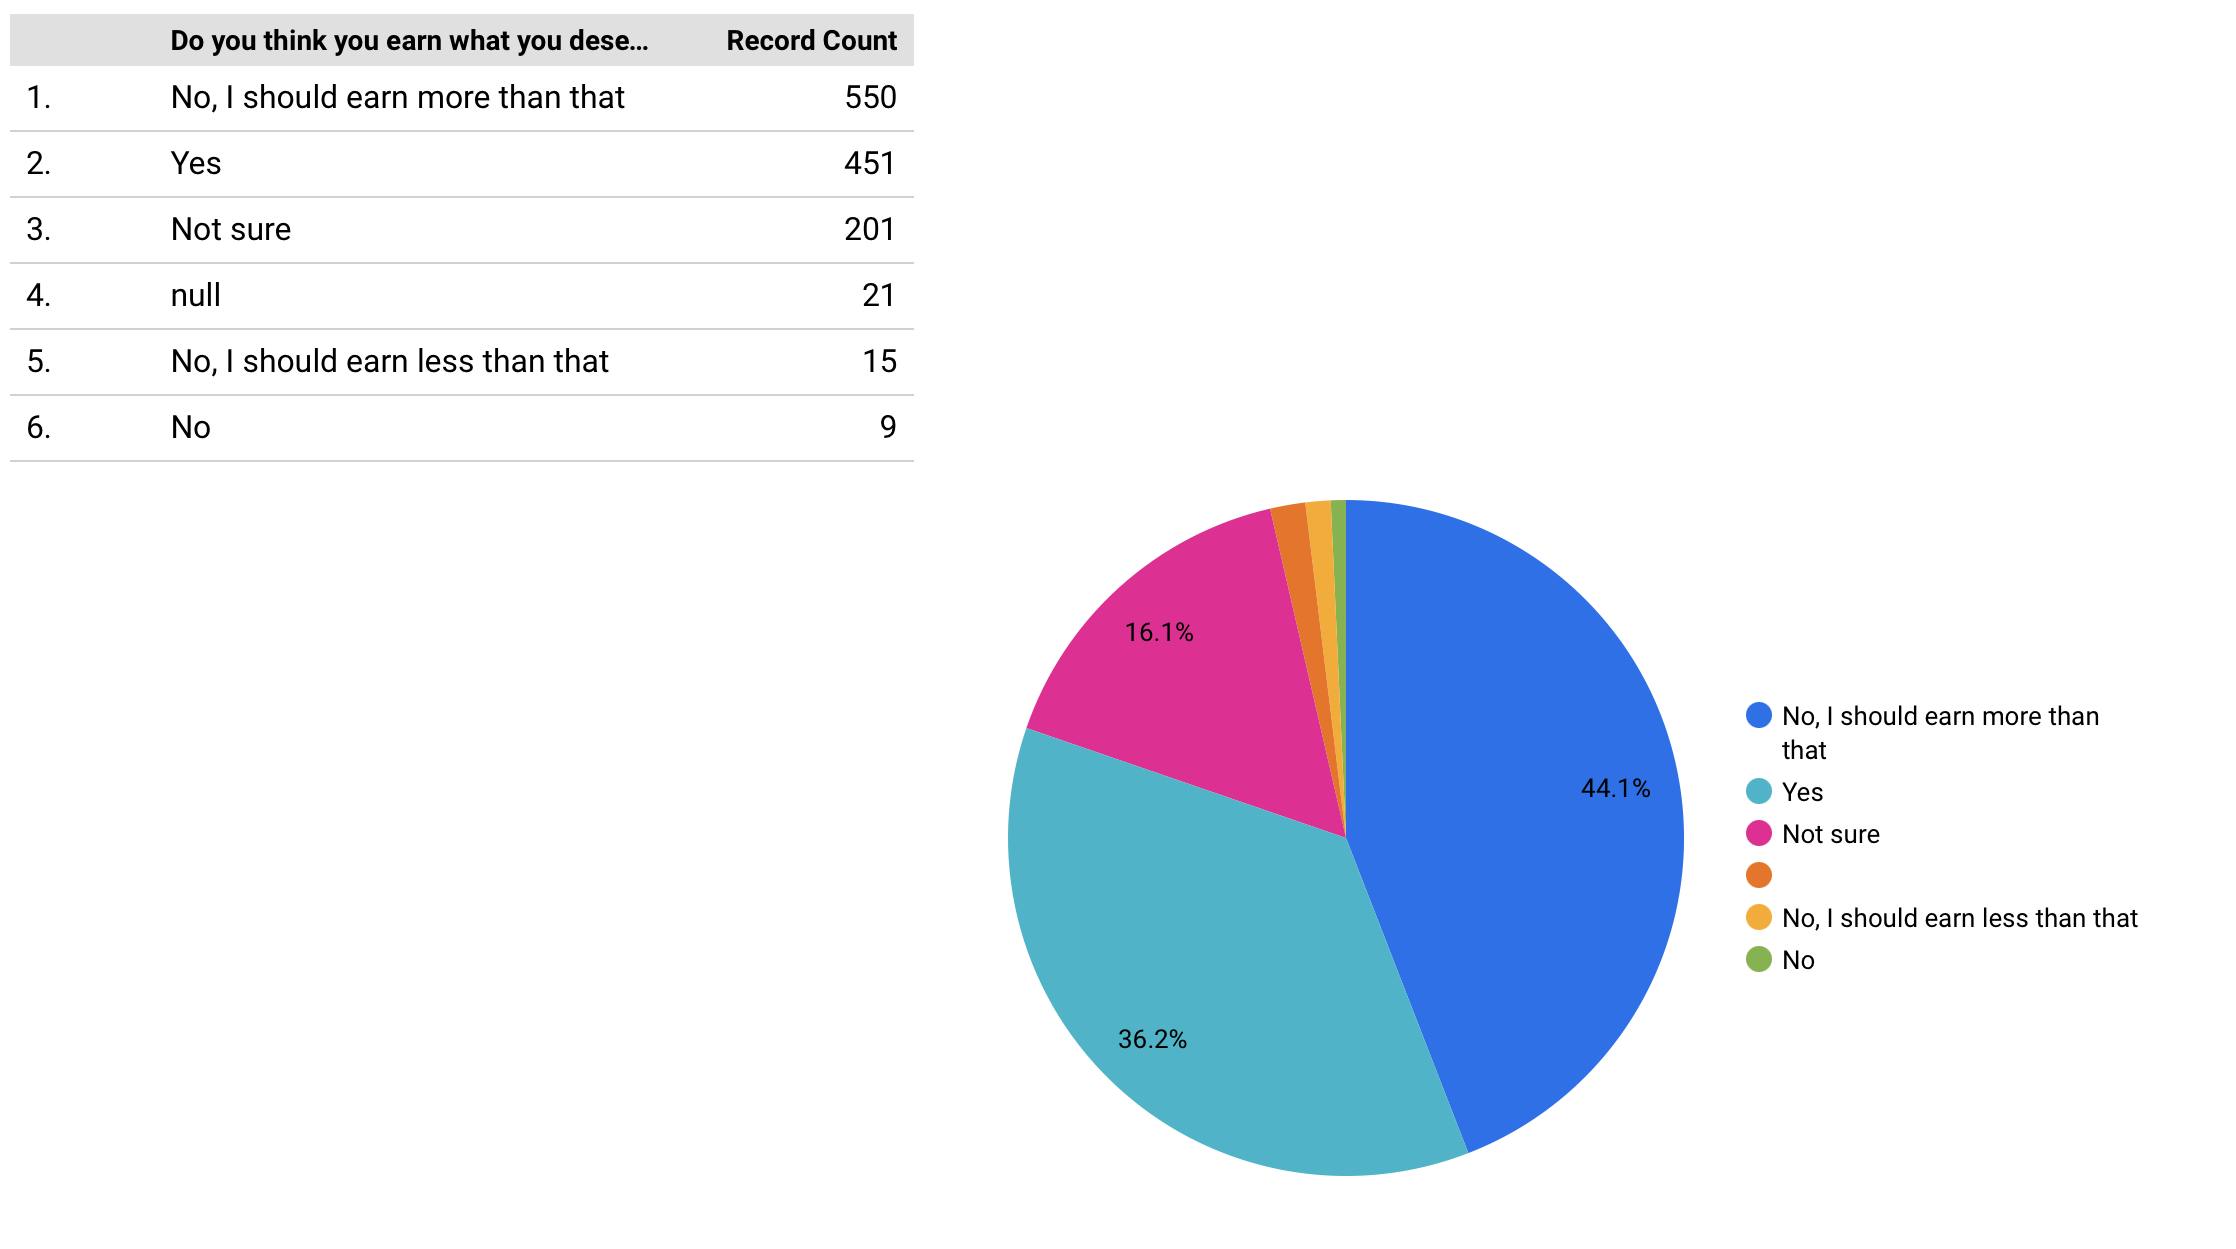
More than 44% of the market think they are underpaid as opposed to only 36% who are satisfied with their earnings. In the full report we will dive into more details to understand this. For example, are the 44% who think they are underpaid actually underpaid? Are the 36% who are satisfied with their salaries on the higher-end or lower-end of the salary ranges? Does gender affect the satisfaction level?
Level Satisfaction
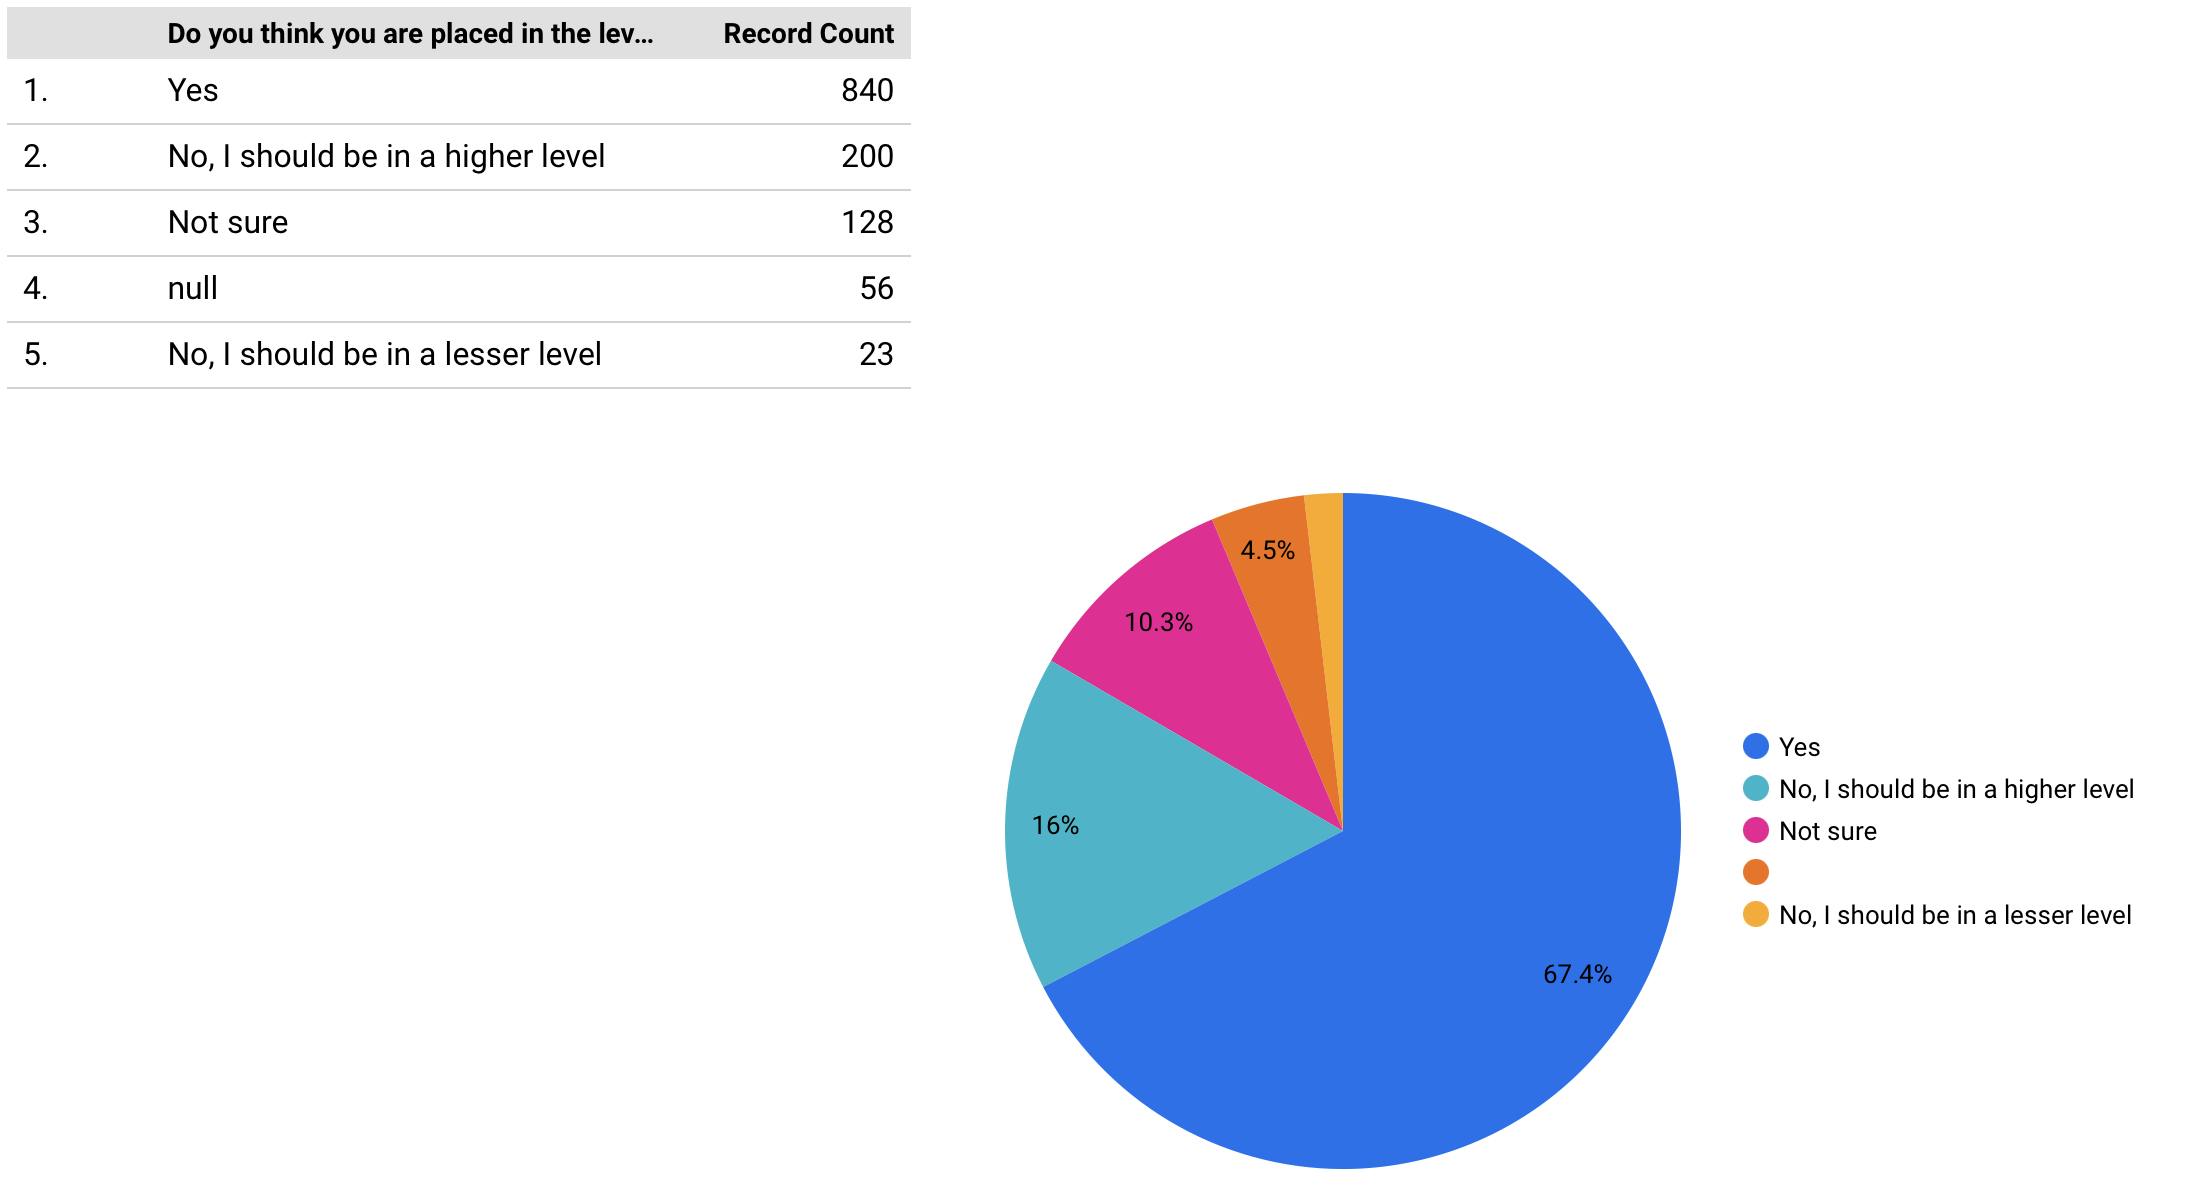
On the other hand, 67% of the market are satisfied by their level. My own interpretation to this is either:
- That the individuals don't really care about levels. This can basically be because at least between the (Juniors, Mid-levels and Seniors) responsibilities and expectations don't change much, and promotions between them don't actually mean more cash.
- That the individuals compare their levels to other markets and find that they are in levels right now that would require them working for few more years in another county to earn the title.
Salaries
We created a datastudio dashboard that you can visit here where you can mix and match the level, years of experience and field. Unfortunately datastudio dashboards aren't very mobile friendly and can lag sometime. So if you want to play with it, make sure you use a computer.
You can see a screenshot from here:
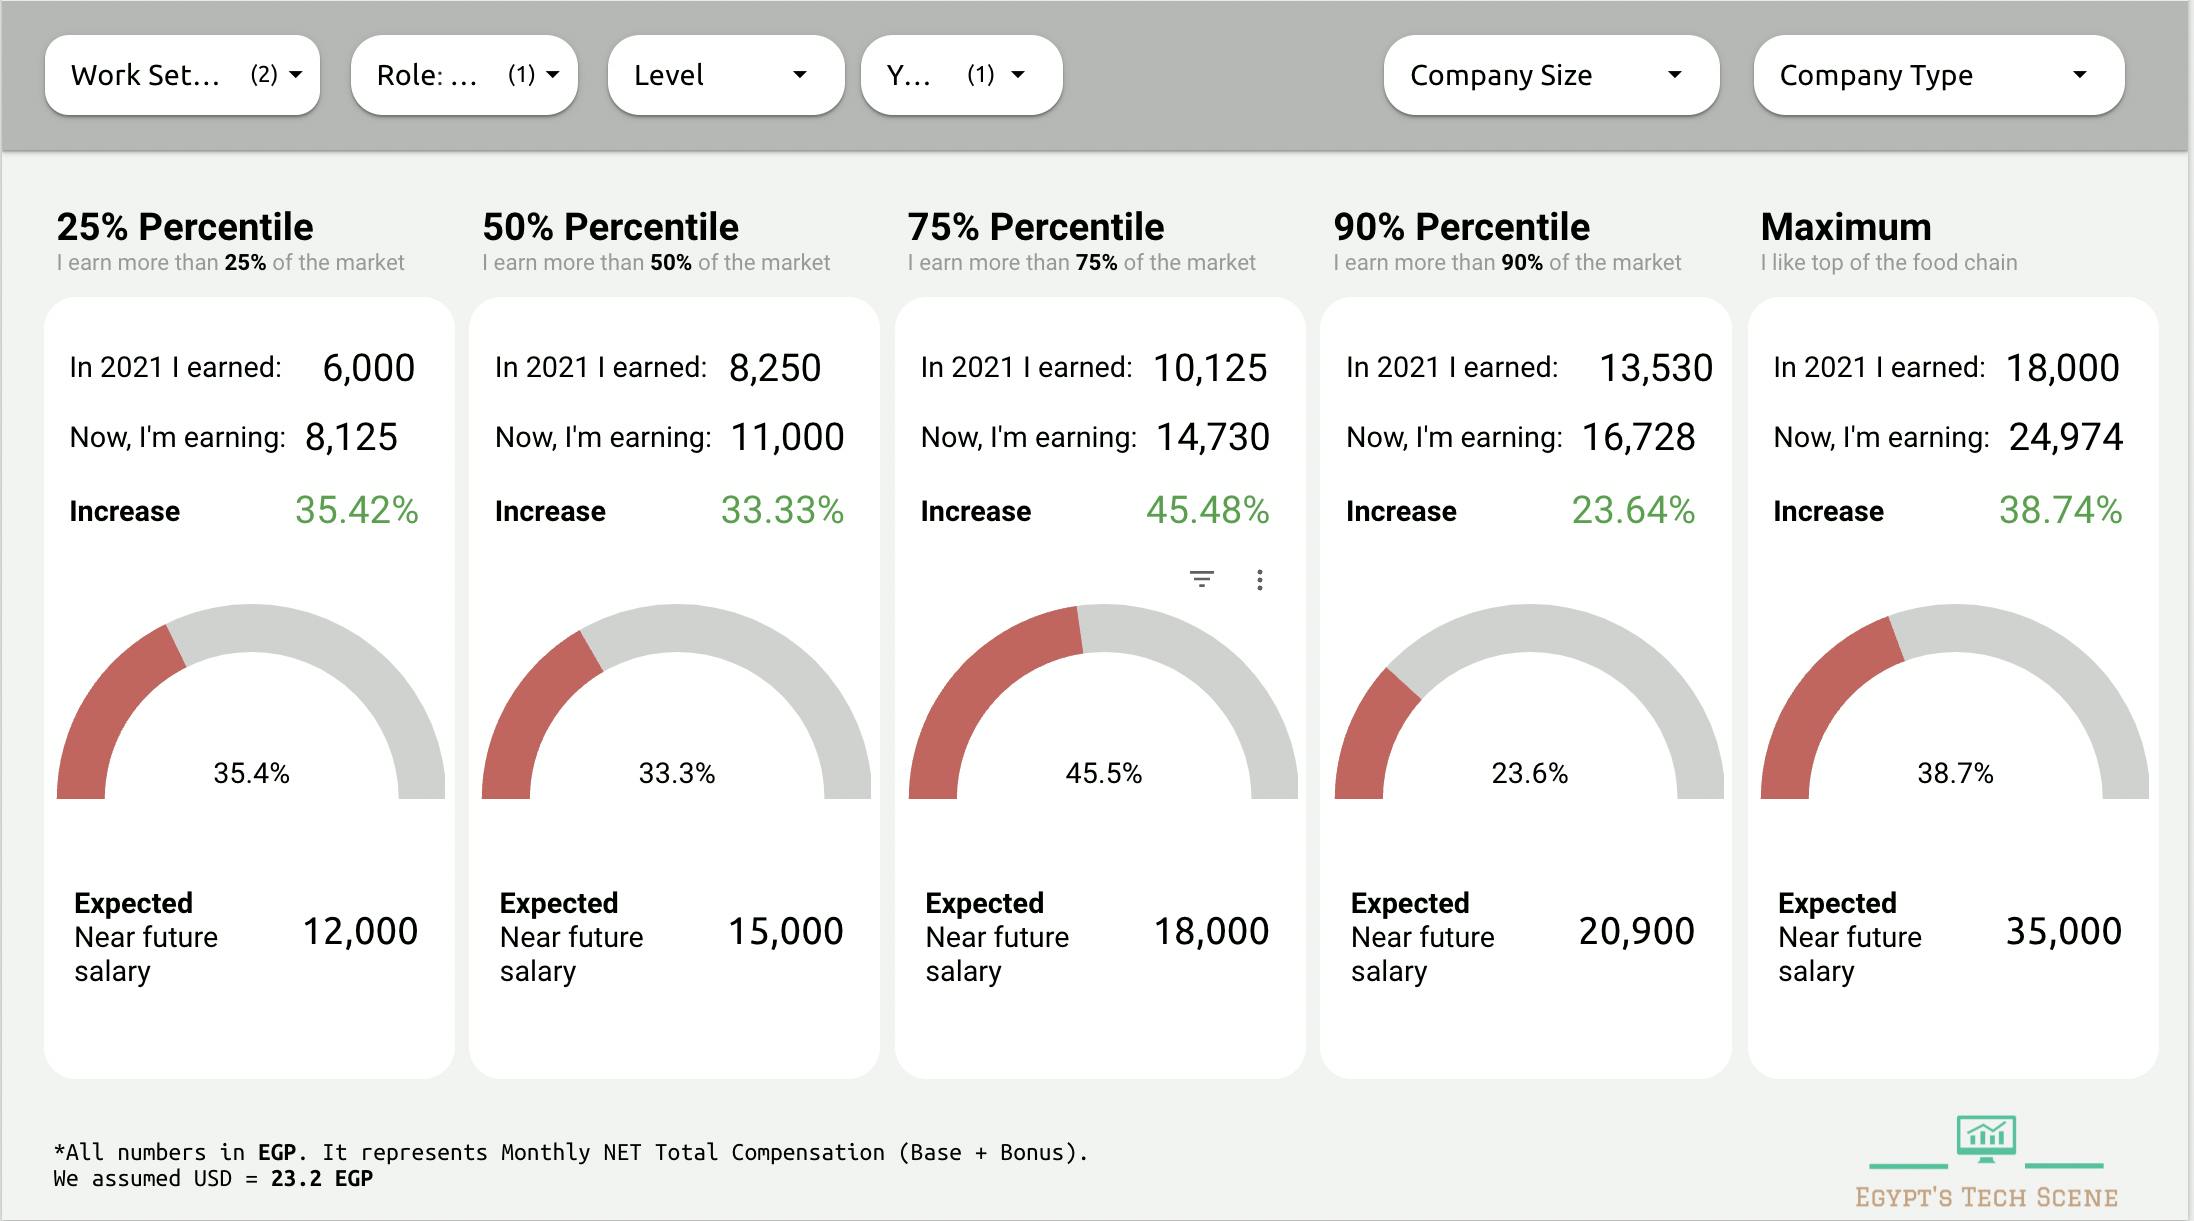
DON'T FORGET TO EXCLUDE THE RELOCATED AND REMOTE EMPLOYEES FROM THE DASHBOARD, IT AFFECTS THE RESULTS IN WAYS YOU CAN'T IMAGINE
I need to highlight that I will always exclude those who have relocated to another county or remote employees working for companies abroad.
Dashboard
In the survey we asked the respondents how much did they earned last year, how much they are earning this year and how much will their expected salary be in case they applied elsewhere. The main motive behind this was to understand how much were salaries adjusted after March's Inflation or when a person jump ships. Also if a company wants to offer competitive salary ranges they might want to look at the expected salary ranges instead of this year's salaries.
Statistics
One of the major mistakes I saw last year was people picking the average and max salaries and negotiate by them. Please don't that. For this year we have added the 25%, 75% and 90% Percentiles. If you feel you're a high-end engineer and deserve high-end salary, you can choose the 75% Percentile as your anchor. Even though we spent hours and hours cleaning the data from unverified outliers, some outliers were actually .. verified. There were some companies, offering very few engineers very high salaries. These companies exist, and it doesn't make sense to delete these records. Also, there were some verified companies offering very small salaries. These can actually affect both the average and the max values.
Therefore I would always go with the 25% Percentile, Median and 75% Percentile as your anchor points to the lower-end, average and high-end salaries.
Next we are going to cover some fields, levels and years of experience ranges, but don't forget that you can still use the dashboard itself to mix and match your criteria and figure out where are you placed in the market.
Backend
All numbers are in EGP. It represents NET Total Compensation. We assumed the USD = 23.2 EGP. We removed remote and relocated employees who work in companies abroad
We received 255 responses from Backend Engineers. The majority were Engineers with 1-3 years of experience.
Level
| Level/Records Count | 25% Percentile | Median | 75% Percentile | 90% Percentile | Max |
| Junior (121) | 7,500 | 10,000 | 13,800 | 18,000 | 40,565 |
| Mid-level (68) | 12,500 | 17,000 | 21,000 | 33,500 | 46,400 |
| Senior (45) | 20,000 | 26,000 | 35,700 | 45,000 | 58,900 |
Swipe the table right and left to see the rest of the table.
Years of Experience
Since we know that levels are company specific, we can use another criteria like Years of Experience to try to figure out where should we lie in this market.
| YoE/Records Count | 25% Percentile | Median | 75% Percentile | 90% Percentile | Max |
| 0-1 (24) | 8,500 | 10,000 | 12,500 | 15,900 | 17,000 |
| 1-3 (124) | 8,000 | 11,000 | 16,000 | 20,500 | 46,400 |
| 3-5 (49) | 16,500 | 20,000 | 25,000 | 31,700 | 46,700 |
| 5-8 (28) | 25,750 | 30,300 | 41,150 | 48,700 | 107,000 |
Swipe the table right and left to see the rest of the table.
Full-stack
All numbers are in EGP. It represents NET Total Compensation. We assumed the USD = 23.2 EGP. We removed remote and relocated employees who work in companies abroad
I was amazed that we actually received around 177 responses from this group (After filtering out the relocated / remote engineers).
Level
| Level/Records Count | 25% Percentile | Median | 75% Percentile | 90% Percentile | Max |
| Junior (84) | 8,000 | 10,250 | 14,000 | 16,000 | 25,000 |
| Mid-level (48) | 10,000 | 15,000 | 18,150 | 25,350 | 60,000 |
| Senior (35) | 18,000 | 24,000 | 31,000 | 35,000 | 58,500 |
Swipe the table right and left to see the rest of the table.
Years of Experience
| YoE/Records Count | 25% Percentile | Median | 75% Percentile | 90% Percentile | Max |
| 0-1 (20) | 8,750 | 10,000 | 12,500 | 14,100 | 23,300 |
| 1-3 (78) | 8,120 | 11,000 | 14,730 | 16,700 | 25,000 |
| 3-5 (44) | 12,250 | 17,750 | 25,000 | 26,750 | 35,000 |
| 5-8 (19) | 18,350 | 24,000 | 34,800 | 35,800 | 58,500 |
Swipe the table right and left to see the rest of the table.
Front-end
All numbers are in EGP. It represents NET Total Compensation. We assumed the USD = 23.2 EGP. We removed remote and relocated employees who work in companies abroad
Moving on to the client side, we received 117 responses from Frontend Engineers.
Level
| Level/Records Count | 25% Percentile | Median | 75% Percentile | 90% Percentile | Max |
| Junior (47) | 7,000 | 10,000 | 15,000 | 19,450 | 30,800 |
| Mid-level (44) | 12,650 | 16,300 | 21,250 | 28,000 | 47,100 |
| Senior (20) | 19,750 | 25,000 | 30,125 | 34,950 | 57,100 |
Swipe the table right and left to see the rest of the table.
Years of Experience
| YoE/Records Count | 25% Percentile | Median | 75% Percentile | 90% Percentile | Max |
| 0-1 (3) | 7,250 | 8,500 | 13,200 | 16,000 | 17,900 |
| 1-3 (58) | 7,000 | 11,750 | 15,000 | 24,200 | 30,800 |
| 3-5 (36) | 16,000 | 18,000 | 21,250 | 27,900 | 47,100 |
| 5-8 (15) | 24,500 | 30,000 | 36,200 | 49,000 | 57,100 |
Swipe the table right and left to see the rest of the table.
Mobile
All numbers are in EGP. It represents NET Total Compensation. We assumed the USD = 23.2 EGP. We removed remote and relocated employees who work in companies abroad
We received around 95 responses from Mobile Engineers (Andriod, IOS, Flutter, etc.). We are going to try to separate them in the full report, but for now due to time limitation, we have to treat them as a unit.
Level
| Level/Records Count | 25% Percentile | Median | 75% Percentile | 90% Percentile | Max |
| Junior (29) | 5,500 | 8,000 | 10,000 | 14,800 | 19,000 |
| Mid-level (25) | 14,000 | 15,800 | 21,000 | 27,200 | 31,000 |
| Senior (17) | 17,000 | 22,000 | 31,000 | 40,000 | 48,250 |
Swipe the table right and left to see the rest of the table.
Years of Experience
| YoE/Records Count | 25% Percentile | Median | 75% Percentile | 90% Percentile | Max |
| 0-1 (6) | 4,500 | 7,000 | 11,000 | 15,500 | 19,000 |
| 1-3 (26) | 6,000 | 8,000 | 12,750 | 17,000 | 22,000 |
| 3-5 (27) | 14,750 | 17,000 | 21,250 | 25,000 | 31,000 |
| 5-8 (11) | 20,500 | 25,000 | 36,700 | 40,000 | 48,250 |
Swipe the table right and left to see the rest of the table.
QA - SDET
All numbers are in EGP. It represents NET Total Compensation. We assumed the USD = 23.2 EGP. We removed remote and relocated employees who work in companies abroad
Level
| Level/Records Count | 25% Percentile | Median | 75% Percentile | 90% Percentile | Max |
| Junior (25) | 8,000 | 10,500 | 13,000 | 17,400 | 27,400 |
| Mid-level (15) | 12,000 | 15,000 | 17,900 | 21,700 | 30,000 |
| Senior (17) | 18,700 | 22,900 | 25,617 | 27,700 | 31,000 |
Swipe the table right and left to see the rest of the table.
Years of Experience
| YoE/Records Count | 25% Percentile | Median | 75% Percentile | 90% Percentile | Max |
| 0-1 (2) | 6,100 | 6,250 | 6,350 | 6,450 | 6,500 |
| 1-3 (26) | 9,450 | 11,800 | 15,100 | 17,150 | 27,400 |
| 3-5 (14) | 17,500 | 19,300 | 23,350 | 25,900 | 31,000 |
| 5-8 (11) | 20,250 | 23,000 | 26,000 | 29,500 | 30,000 |
Swipe the table right and left to see the rest of the table.
DevOps
All numbers are in EGP. It represents NET Total Compensation. We assumed the USD = 23.2 EGP. We removed remote and relocated employees who work in companies abroad
Level
| Level/Records Count | 25% Percentile | Median | 75% Percentile | 90% Percentile | Max |
| Junior (25) | 10,000 | 12,000 | 15,000 | 16,000 | 18,000 |
| Mid-level (12) | 16,750 | 22,200 | 29,400 | 30,300 | 59,300 |
| Senior (9) | 22,400 | 30,000 | 34,600 | 38,500 | 53,500 |
Swipe the table right and left to see the rest of the table.
Years of Experience
| YoE/Records Count | 25% Percentile | Median | 75% Percentile | 90% Percentile | Max |
| 0-1 (5) | 9,000 | 10,000 | 12,000 | 14,820 | 16,700 |
| 1-3 (25) | 11,000 | 14,500 | 16,000 | 29,950 | 72,400 |
| 3-5 (8) | 17,900 | 24,200 | 29,800 | 31,380 | 34,600 |
| 5-8 (5) | 21,200 | 22,400 | 29,000 | 43,700 | 53,500 |
Swipe the table right and left to see the rest of the table.
Embedded
All numbers are in EGP. It represents NET Total Compensation. We assumed the USD = 23.2 EGP. We removed remote and relocated employees who work in companies abroad
Level
| Level/Records Count | 25% Percentile | Median | 75% Percentile | 90% Percentile | Max |
| Junior (20) | 14,500 | 15,700 | 17,000 | 19,200 | 20,800 |
| Mid-level (9) | 17,500 | 18,650 | 23,700 | 35,950 | 71,400 |
| Senior (3) | 25,100 | 27,250 | 28,000 | 28,600 | 28,950 |
Swipe the table right and left to see the rest of the table.
Years of Experience
| YoE/Records Count | 25% Percentile | Median | 75% Percentile | 90% Percentile | Max |
| 0-1 (10) | 14,700 | 16,000 | 17,300 | 19,150 | 20,800 |
| 1-3 (15) | 15,250 | 16,000 | 18,400 | 20,000 | 23,700 |
| 3-5 (6) | 24,000 | 27,200 | 28,500 | 30,800 | 32,650 |
| 5-8 (4) | 36,900 | 39,700 | 48,000 | 62,000 | 71,400 |
Swipe the table right and left to see the rest of the table.
Product Managers
All numbers are in EGP. It represents NET Total Compensation. We assumed the USD = 23.2 EGP. We removed remote and relocated employees who work in companies abroad
Level
| Level/Records Count | 25% Percentile | Median | 75% Percentile | 90% Percentile | Max |
| Junior (11) | 8,500 | 11,000 | 15,000 | 28,000 | 37,300 |
| Mid-level (19) | 20,500 | 25,000 | 37,250 | 42,600 | 47,600 |
| Senior (6) | 21,450 | 29,450 | 36,600 | 42,700 | 47,600 |
Swipe the table right and left to see the rest of the table.
Years of Experience
| YoE/Records Count | 25% Percentile | Median | 75% Percentile | 90% Percentile | Max |
| 0-1 (0) | 0 | 0 | 0 | 0 | 0 |
| 1-3 (15) | 9,500 | 13,000 | 18,000 | 22,000 | 28,000 |
| 3-5 (9) | 15,000 | 22,000 | 30,000 | 38,500 | 47,600 |
| 5-8 (7) | 35,700 | 38,750 | 44,800 | 57,100 | 71,400 |
Swipe the table right and left to see the rest of the table.
Product Owners
All numbers are in EGP. It represents NET Total Compensation. We assumed the USD = 23.2 EGP. We removed remote and relocated employees who work in companies abroad
Level
| Level/Records Count | 25% Percentile | Median | 75% Percentile | 90% Percentile | Max |
| Junior (4) | 9,300 | 9,875 | 10,500 | 11,400 | 12,000 |
| Mid-level (7) | 13,250 | 14,000 | 17,000 | 22,650 | 28,150 |
| Senior (8) | 20,000 | 28,800 | 35,150 | 39,500 | 40,000 |
Swipe the table right and left to see the rest of the table.
Years of Experience
| YoE/Records Count | 25% Percentile | Median | 75% Percentile | 90% Percentile | Max |
| 0-1 (1) | 12,000 | 12,000 | 12,000 | 12,000 | 12,000 |
| 1-3 (7) | 8900 | 10,000 | 12,500 | 16,000 | 19,000 |
| 3-5 (4) | 25,700 | 28,800 | 32,300 | 36,500 | 39,200 |
| 5-8 (4) | 18,750 | 24,000 | 31,000 | 36,500 | 40,000 |
Swipe the table right and left to see the rest of the table.
UI/UX
All numbers are in EGP. It represents NET Total Compensation. We assumed the USD = 23.2 EGP. We removed remote and relocated employees who work in companies abroad
Level
| Level/Records Count | 25% Percentile | Median | 75% Percentile | 90% Percentile | Max |
| Junior (10) | 6,250 | 8,000 | 12,750 | 14,700 | 29,700 |
| Mid-level (11) | 9,000 | 12,000 | 14,750 | 19,000 | 33,000 |
| Senior (5) | 18,500 | 22,500 | 30,250 | 36,000 | 40,000 |
Swipe the table right and left to see the rest of the table.
Years of Experience
| YoE/Records Count | 25% Percentile | Median | 75% Percentile | 90% Percentile | Max |
| 0-1 (1) | 13,000 | 13,000 | 13,000 | 13,000 | 13,000 |
| 1-3 (11) | 6,500 | 8,900 | 12,500 | 18,000 | 29,750 |
| 3-5 (9) | 10,000 | 14,200 | 17,000 | 20,200 | 25,000 |
| 5-8 (4) | 16,125 | 26,000 | 32,250 | 32,700 | 33,000 |
Swipe the table right and left to see the rest of the table.
Data Analytics
All numbers are in EGP. It represents NET Total Compensation. We assumed the USD = 23.2 EGP. We removed remote and relocated employees who work in companies abroad
Level
| Level/Records Count | 25% Percentile | Median | 75% Percentile | 90% Percentile | Max |
| Junior (26) | 7,250 | 10,000 | 10,850 | 12,250 | 16,000 |
| Mid-level (6) | 12,900 | 20,250 | 26,500 | 28,750 | 29,500 |
| Senior (3) | 21,500 | 29,300 | 29,600 | 29,800 | 30,000 |
Swipe the table right and left to see the rest of the table.
Years of Experience
| YoE/Records Count | 25% Percentile | Median | 75% Percentile | 90% Percentile | Max |
| 0-1 (1) | 10,400 | 10,400 | 10,400 | 10,400 | 10,400 |
| 1-3 (26) | 7,250 | 10,000 | 12,000 | 15,000 | 29,500 |
| 3-5 (6) | 11,000 | 14,000 | 17,450 | 24,000 | 29,350 |
| 5-8 (2) | 28,500 | 29,000 | 29,500 | 29,800 | 30,000 |
Swipe the table right and left to see the rest of the table.
Data Scientists
All numbers are in EGP. It represents NET Total Compensation. We assumed the USD = 23.2 EGP. We removed remote and relocated employees who work in companies abroad
Level
| Level/Records Count | 25% Percentile | Median | 75% Percentile | 90% Percentile | Max |
| Junior (17) | 9200 | 11,000 | 14,000 | 18,400 | 23,800 |
| Mid-level (7) | 12,720 | 14,850 | 21,000 | 24,400 | 25,000 |
| Senior (3) | 32,000 | 38,000 | 52,900 | 61,800 | 67,800 |
Swipe the table right and left to see the rest of the table.
Years of Experience
| YoE/Records Count | 25% Percentile | Median | 75% Percentile | 90% Percentile | Max |
| 0-1 (3) | 11,880 | 12,500 | 18,150 | 21,550 | 23,800 |
| 1-3 (18) | 9,400 | 11,500 | 14,650 | 18,300 | 25,000 |
| 3-5 (4) | 16,000 | 21,000 | 24,505 | 25,500 | 26,000 |
| 5-8 (2) | 39,600 | 41,150 | 42,750 | 43,700 | 44,350 |
Swipe the table right and left to see the rest of the table.
Data Engineers
All numbers are in EGP. It represents NET Total Compensation. We assumed the USD = 23.2 EGP. We removed remote and relocated employees who work in companies abroad
Level
| Level/Records Count | 25% Percentile | Median | 75% Percentile | 90% Percentile | Max |
| Junior (10) | 9250 | 10,500 | 12,250 | 17,850 | 27,360 |
| Mid-level (9) | 23,800 | 28,000 | 29,150 | 39,050 | 46,000 |
| Senior (5) | 26,700 | 30,000 | 35,000 | 42,200 | 47,000 |
Swipe the table right and left to see the rest of the table.
Years of Experience
| YoE/Records Count | 25% Percentile | Median | 75% Percentile | 90% Percentile | Max |
| 0-1 (3) | 7,250 | 10,000 | 10,500 | 10,800 | 11,000 |
| 1-3 (10) | 10,400 | 14,650 | 26,800 | 28,100 | 29,150 |
| 3-5 (5) | 23,800 | 28,000 | 35,000 | 41,600 | 46,000 |
| 5-8 (3) | 22,500 | 30,000 | 33,650 | 35,900 | 37,350 |
Swipe the table right and left to see the rest of the table.
Conclusion
We would like to thank the 1300 individuals who took from their times and helped us by filling their details. We also would like to thank the hundreds of friends, colleagues or even strangers who were helping us by sharing the survey with their networks.
We hope that this post and dashboard will help you in your coming steps.
Exactly like the last year, we will make sure to publish all the data we have collected without any PII with the full report by the end of November.
Team
This report was a group effort between:
Copy Rights
You're free to use the information in here in anyway you see fit. But please give the credit back to this article and the team. We spend hours working on this for free, the only thing we expect is a simple recognition and credit for our work.